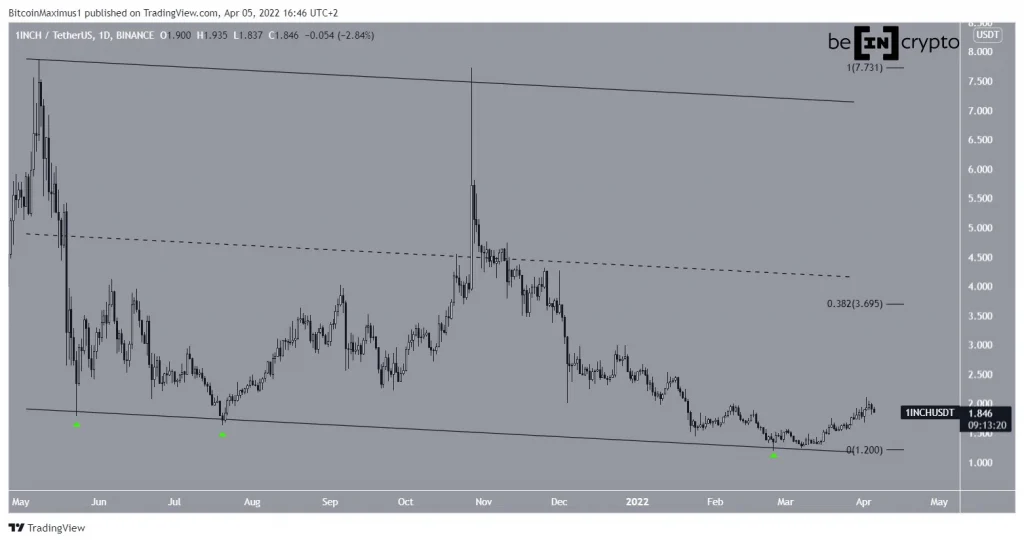
1inch (1INCH) has broken out from a short-term pattern and is attempting to find support in order to resume its upward movement.
1INCH has been falling since Oct. 27, when it reached a high of $7.73. The decrease began with a very long upper wick (red icon), which is considered a sign of selling pressure.
So far, the price has reached a low of $1.18 on Feb 24. The low served to validate the support line of a long-term descending parallel channel for the third time (green icons). Therefore, the entire movement since May 2021 has been contained inside this channel.
The first significant resistance area is at $3.70. This is the 0.382 Fib retracement resistance level and is very close to the middle of the channel.
How long will 1INCH increase?
Cryptocurrency trader @CryptoNTez tweeted a chart of 1INCH, stating that the token could increase all the way to $2.50.
1INCH has already broken out from a short-term descending wedge, suggesting that it has begun an upward movement. The breakout was preceded by bullish divergences in both the RSI and MACD (green lines).
While it reached a high of $2.10 on April 2, it was rejected by the 0.5 Fib retracement resistance level and has been falling since.
However, due to the fact that the MACD and RSI are still bullish, it is likely that the daily trend is still bullish.
Wave count analysis
Since the May 8 all-time high, it seems that 1INCH has completed an A-B-C, flat corrective structure. The fact that waves A:C have had an exactly 1:1 ratio and that the movement is contained inside a descending parallel channel support this possibility.
If correct, 1INCH would be expected to increase considerably, potentially reaching new highs. This is also in line with technical indicator readings from the daily time-frame.
The short-term movement suggests that 1INCH is in the process of completing a fourth wave pullback. This is an occurrence in which a sharp fall completes wave four. Afterwards, the fifth and final upward movement begins.
The $1.66 – $1.76 area offers the most confluence for a bottom. It is the 0.382-0.5 Fib retracement support level of wave three. Additionally, the former level coincides with the middle of the previous parallel channel, while the latter with its resistance line.
As a result, the most likely scenario has 1INCH bouncing at one of these levels and resuming its upward movement.
For BeInCrypto’s latest Bitcoin (BTC) analysis, click here
Disclaimer
All the information contained on our website is published in good faith and for general information purposes only. Any action the reader takes upon the information found on our website is strictly at their own risk.


