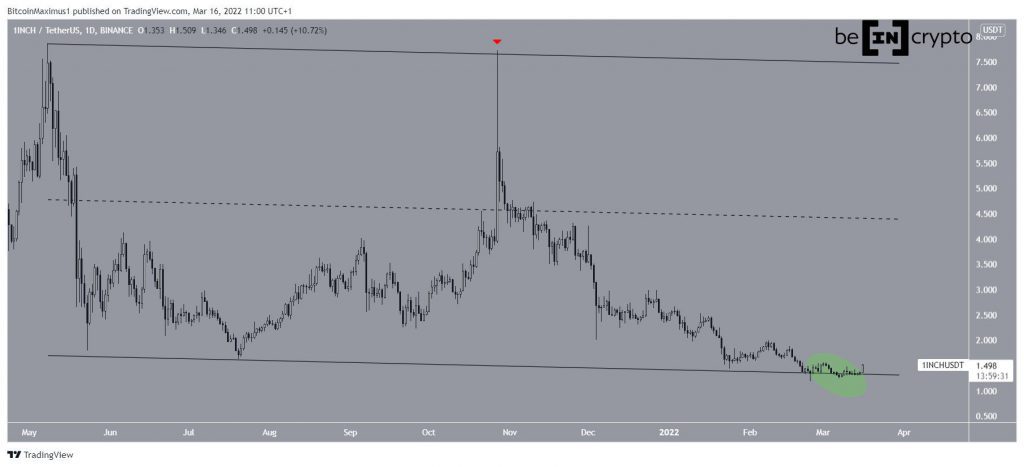
1Inch (1INCH) has been increasing since Feb 24, accelerating its rate on March 16.
1INCH has been falling since reaching an all-time high price of $7.87 on May 8. On Oct 27, it created a slightly lower high (red icon) and a long upper wick. This next downward movement led to a low of $1.18 on Feb 24.
1INCH has also been trading inside a long-term descending parallel channel since its all-time high. Price movement since Feb 24 has caused several validations of its support line.
Currently, the middle of the channel is at $4.45.
Future 1INCH movement
Technical indicators in the daily time frame are bullish. This can be seen by the pronounced bullish divergence in both the RSI and MACD (green lines). Such divergences very often precede significant bullish trend reversals.
While the MACD has not yet crossed into positive territory, the RSI is already above 50, which is a sign of a bullish trend.
Therefore, technical indicators in the daily time frame are gradually turning bullish.

Cryptocurrency trader @THE_FLASH_G tweeted a chart showing a price break out is imminent.
Since the tweet, 1INCH has broken out from a descending wedge and moved upwards at an accelerated rate. The closest resistance area is at $1.83, which is the 0.382 fib retracement resistance level.
Wave count analysis
The entire movement since May 2021 resembles an A-B-C collective structure (black). The fact that the movement is contained inside a descending parallel channel supports this possibility.
In addition to this, waves A:C have been at an exactly 1:1 ratio, which is common in such structures.
Therefore, it is possible that the long-term correction has come to an end.
For BeInCrypto’s latest Bitcoin (BTC) analysis, click here
Disclaimer
All the information contained on our website is published in good faith and for general information purposes only. Any action the reader takes upon the information found on our website is strictly at their own risk.


