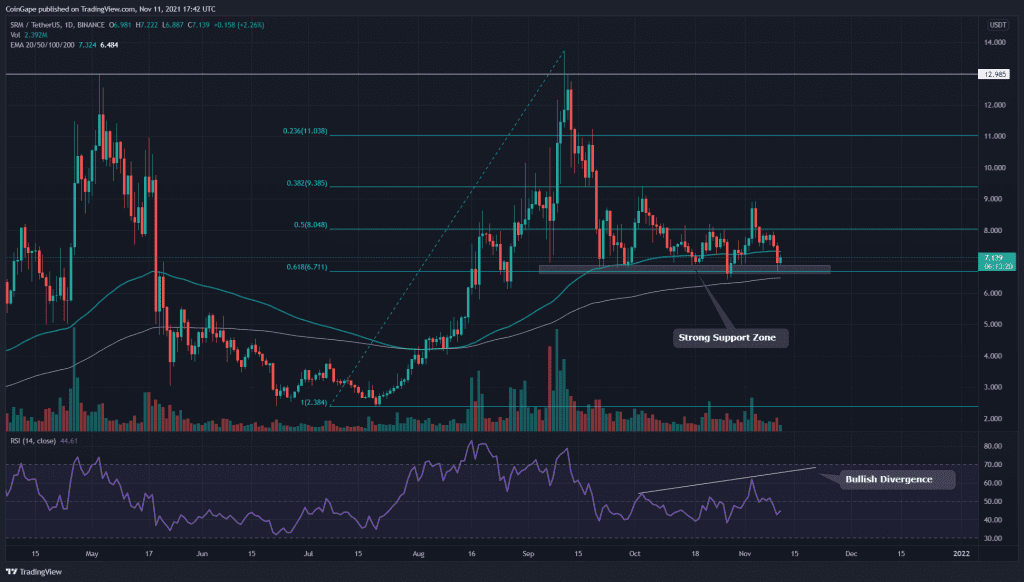
From a technical perspective, the SRM/USD chart indicates the overall trend for the coin remains bullish, as its price shows good sustainability above the $6.8 level. Once the price is out for its consolidation phase, the crypto can expect a strong directional movement in SRM price.
Key technical points to consider:
- The SRM coins daily RSI has started indicting positive in its chart
- The intraday trading volume in the SRM coin is $225.4 Million, indicating a massive 58.75% hike
Source- SRM/USD chart by Tradingview
On September 11th, the SRM coin rally retested the All-Time High resistance of the $13 mark. The coin faced intense selling pressure from this level and initiated a retracement phase in its technical chart.
This moderate retracement plunged the SRM price to the $6.7 level or 0.618 FIB level on September 21st, and since then, the price has been wavering around this support.
The SRM coin is still trading above the 200 EMA, indicating the bullish trend is still intact. As for the Relative Strength Index(44), it projects the current sentiment is slightly bearish. However, the RSI line has also started forming a bullish divergence in its chart suggesting the bulls are slowly gaining momentum.
SRM/USD Chart In The 4-hour Time Frame

Source- SRM/USD chart by Tradingview
As for now, the SRM coin price is struggling to rally higher from the $7-$6.8 support zone. However, the daily time frame showed the 200 EMA is gradually closing to the SRM price, and maybe this support line can provide enough push to get this coin back on track.
According to traditional pivot levels, the nearest resistance for this coin would be at $7.9, followed by $8.8, and on the flip side, the support level is present at $6.8, and later at $5.8


