Is Bitcoin (BTC) price on its way to $100k? Recent readings of the Consumer Price Index [CPI] reveal an increase of 6.2% last month October, compared to last year. Analysts speculate that a steady inflation rate at 6.2% for the 10yrs would bring a 100,000 USD savings to 54,000 USD in the future.
The record-high inflation values draw investors closer into the Bitcoin BTC markets as a possible hedge.
Let’s analyze the charts, starting with Bitcoin dominance, the monthly chart of the BTCUSDT, all the way down to the intraday 4HR time frame.
Bitcoin Dominance (BTC.D) Monthly Chart Analysis
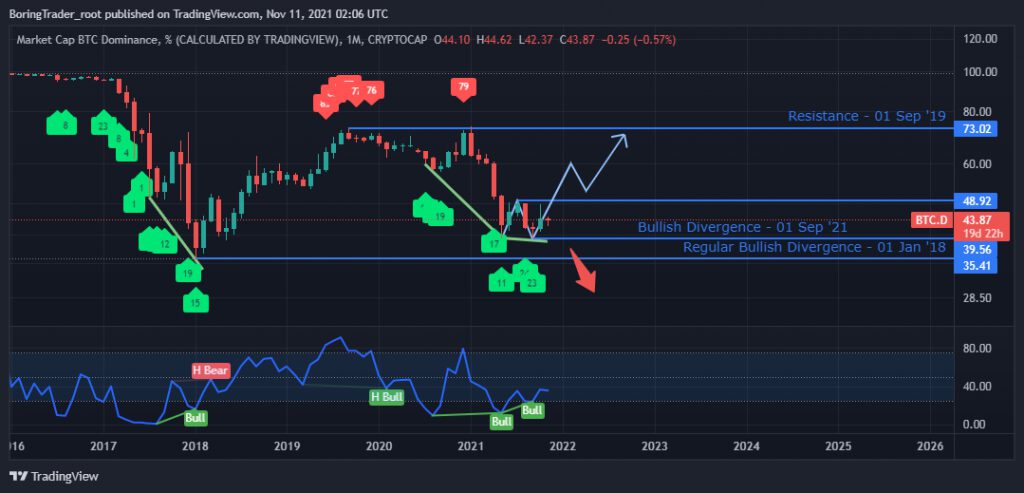
A view into the Bitcoin BTC dominance chart shows a similar regular bullish divergence that marked the crypto boom of 2017.
Consecutive regular bullish divergence patterns on 01 September show a slowing of the alt-season and investors could start moving their funds into Bitcoin BTC, which means they may soon become risk-averse to altcoins.
Conversely, a continuous decline in BTC dominance would imply a prolonged crypto bull market and a later crypto winter.
Let’s move on to analyze the weekly, daily, and 4HR time frames of the BTCUSDT.
Bitcoin (BTC) Monthly Chart Analysis

Looking at the BTCUSDT from the highest time frame, the monthly time frame allows us a bird’s eye overview of the current bullish divergence pattern that’s driving the price higher and a possible regular bearish divergence that could bring about a crypto winter by the end of the year.
The hidden bullish divergence of 01 June is the current significant driver of the Bitcoin BTC price and we could see the number one crypto asset finally reach the 100K USD mark.
Bitcoin (BTC) Weekly Chart Analysis

An increase in bullish momentum forced the Bitcoin BTC price to reject the regular bearish divergence resistance of 18 October ’21, a long-awaited confirmation that we are well on our way into higher price zones beyond the current ATH.
The significant resistance on the path of the number one cryptocurrency is taken out and the bullish campaign is set for a price surge towards the 100K round-number resistance.
Bitcoin (BTC) Daily Chart Analysis

A series of hidden bullish divergence builds confidence for traders and investors to HODL Bitcoin into the end of Q4 ’21.
Higher RSI values above level-25 also show that the uptrend remains intact and we could see a prolonged bullish swing going forward into the second half of Q4 ’21.
Bitcoin (BTC) 4 Hr Chart Analysis

Bitcoin price nosedived as seen on the intraday chart by roughly 8% following a regular bearish divergence setup on 10 November 12:00.
The dust appears to be settling down at press time and we may start to see the bulls resume control of the BTC trend to the upside.
A recent breakout of bearish inside bar resistance at press time confirms the bullish takeover.


