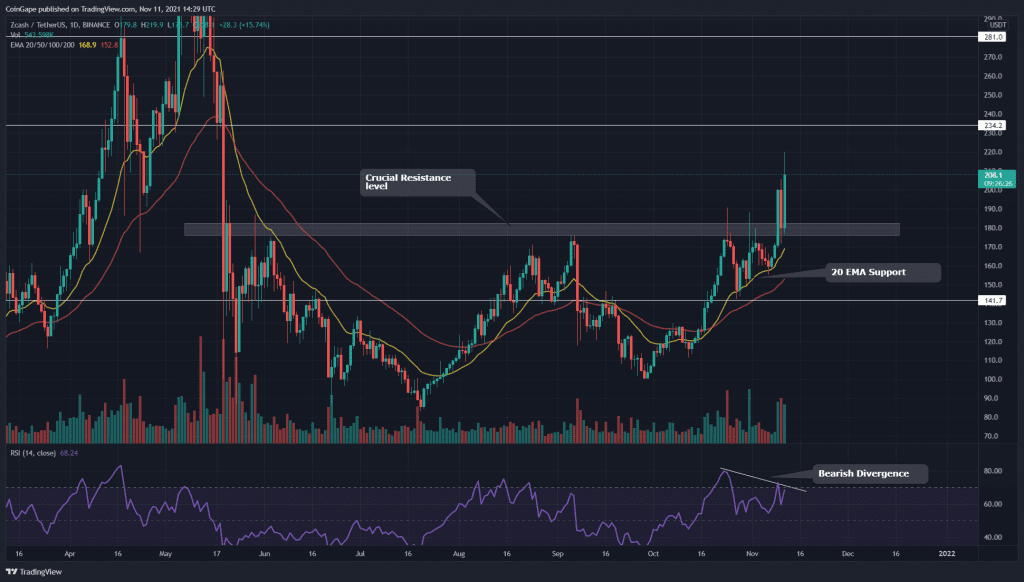
From a technical perspective, the ZEC/USD chart indicates a positive outlook for this coin, as the price has managed to reclaim an important resistance zone at the $180 mark, suggesting high potential for ZEC coin price.
Key technical points to consider:
- The 20 EMA line is providing strong support to the ZEC price
- The ZEC coins daily RSI chart displays a bearish divergence
- The intraday trading volume in the ZEC coin is $864.3 Million, indicating an 18% hike
Source- ZEC/USD chart by Tradingview
Since the sudden fall on May ‘21 in the crypto market, the ZEC coin price had never passed the $180 mark. The coin price tested this resistance level multiple times only to face strong rejection from it.
However, on November 9th, the ZEC price finally provided a proper breakout from this level with a solid green candle and sufficient support from the volume activity, offering the crypto traders an excellent long opportunity in this coin.
The crucial EMAs(20, 50, 100, and 200) indicate a strong uptrend, where the coin price is trading above these EMA lines. Moreover, the 20 EMA line acts as dynamic support for ZEC price.
The Relative Strength Index(RSI) value is 67, indicating a bullish sentiment for the coin. However, the RSI also shows a bearish divergence, suggesting some weakness in this rally.
ZEC/USD Chart In The 4-hour Time Frame

Source- ZEC/USD chart by Tradingview
The ZEC coin in this lower time frame chart displays a clear retest phase of the $180 level. The chart also shows a strong follow-up candle for the confirmation of a new rally. This coin is currently trading at $207.18, with an intraday gain of 15.24%.
However, the bearish divergence of the daily chart adds a slight concern for this coin, and therefore, the crypto trader should proper risk management and maintain a bullish sentiment for this coin at least till its sustains above the $180 mark.


