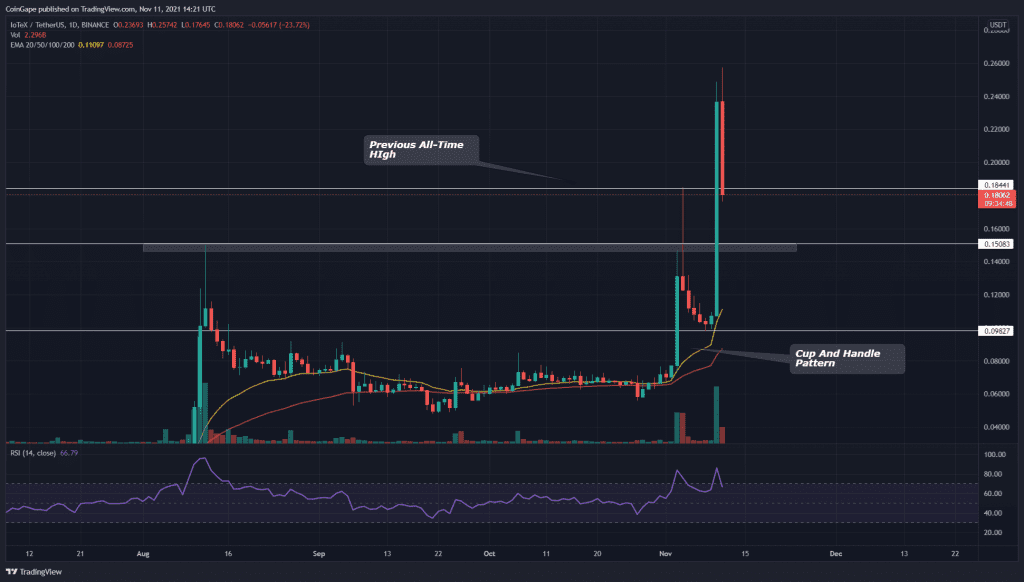
The technical outlook for IOTX/USD states a strong bullish trend. On November 10th, the coin showed a sudden price surge of 124% in its intraday session and also reclaimed the previous All-Time High of $0.185. Will IOTX price breach the $0.3 mark?
Significant points to ponder:
- The IOTX coin price breaks out from the cup and handle pattern
- The IOTX coin maintains a strong buzz on the social media platform
- The intraday trading volume in the IOTX coin is $427.6 Million, indicating a 73.52% hike
Source- IOTX/USD chart by Tradingview
We are just halfway to November month, and the IOTX coin has shown remarkable growth in its price. Moreover, The technical chart indicated a bullish Cup and Handle pattern in the daily time frame chart.
The neckline for this pattern was situated at the $0.15 mark, and on November 10th, the coin price provided a massive green candle of $120% gain breaching the overhead resistance, with a substantial spike in trading volume.
Furthermore, the crucial EMAs(20, 50, 100, and 200) indicate a solid bullish, as the coin price is trading high above these EMA lines. The Relative Strength Index(RSI) value is 67, projecting a bullish sentiment for the coin.
IOTX/USD Chart In The 4-hour Time Frame

Source- IOTX/USD chart by Tradingview
The IOTX coin displays a minor pullback in its chart, as the price wants to retest the bullish breakout of the price pattern. As per the Fibonacci retracement levels, the crypto traders can expect the nearest support level for this coin at $0.18(0.236 FIB), followed by $0.157(0.5 FIB) and later $0.132(0.618 FIB level)
These are some crucial support levels for the IOTX/USD chart that can help this coin continue its rally. The current price of the IOTX is $0.183, with intraday gains of 23.48%.


