Speculation has been going on in the crypto community as to whether the $69k Bitcoin top was the peak of this bull run. Here’s a comparison between some indicators to see how this top compares with the $65k April peak.
Comparing the Metrics Between The Nov 10th And April 14th Peaks
As per the latest weekly report from Arcane Research, most of the sentiment measuring metrics highlight the differences between the two tops.
The first relevant metric is the futures open interest indicator, which shows the total amount of Bitcoin involved in futures contracts at the end of a trading day.
Here is how its chart compares between the April and November peaks:

Looks like April 14th top had decently more open interest
As you can see above, the April peak had almost 50k BTC more in open interest. This means that there was much more excess leverage in the market back then.
Related Reading | Brace For More Downtrend: 15% Of Bitcoin Supply Is Now In Loss
Below is another chart that compares the unregulated futures basis between the two tops. “Basis” is basically the difference between Bitcoin’s price and the futures price.

Average 3-month annualized basis in the unregulated futures market
The unregulated futures market basis reached almost 50% on April 14th while it was only 17% during November 10th.
The basis gap between the unregulated market and CME was also higher for the former top, and so was the Korean premium. The funding rates, as well, showed substantially higher values for the period.

Nov 10th recorded relatively less overheated indicators
What these metrics show is that the futures froth was clearly more pronounced during the April top, and that the market was more overextended.
Two other indicators, however, had higher values for Nov 10th. The first of these was the fear and greed index, a metric that measures how fearful or greedy the market is.
Related Reading | TA: Ethereum Show Positive Signs, Why ETH Could Outperform Bitcoin
The other was the global open interest share of Bybit and Binance. Here are how these indicators looked like for the two periods:

The metrics where Nov 10th lead April 14th
In conclusion the $69k Nov top has some clear differences from the $65k April peak. So it’s possible this might not be the bull run peak just yet. Some other on-chain indicators also back the idea.
Bitcoin Price
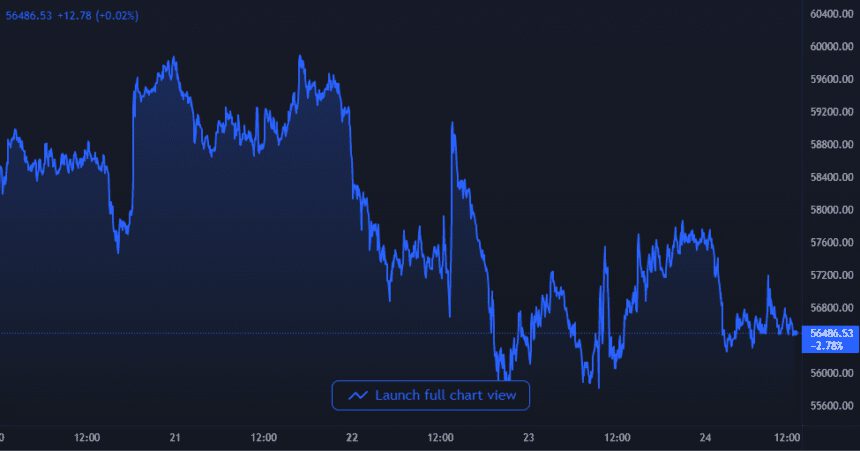
At the time of writing, Bitcoin’s price floats around $56.5k, down 6% in the last seven days. Over the past month, the coin has lost 10% in value.
Here is a chart that shows the trend in the price of the coin over the past five days:
BTC's price continues to tumble down | Source: BTCUSD on TradingView
Featured image from Unsplash.com, charts from TradingView.com, Arcane Research


