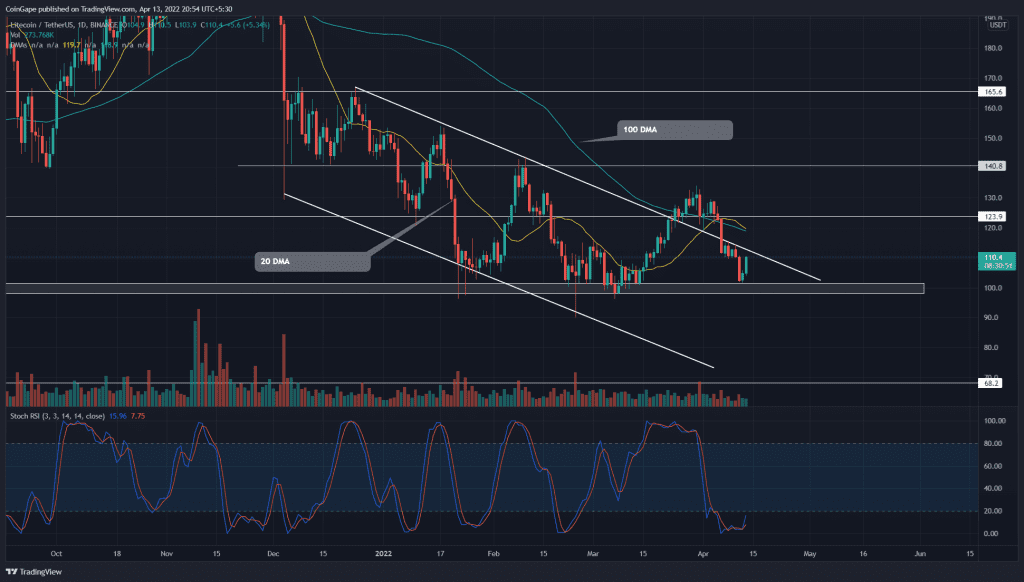
The Litecoin(LTC) price dramatically dropped after the $124 resistance fakeout on April 5th. As a result, the altcoin descended 18% and sank to its last quarter bottom support at $100. However, the LTC price bounced back from the mentioned support, indicating a dip opportunity for long traders.
Key points
- The $100 support level maintains a strong accumulation zone
- The intraday trading volume in the Litecoin coin is $748..5 Million, indicating a 1.47% gain.
Source- Tradingview
On March 24th, the LTC/USDT pair broke out from a three-month-old falling wedge pattern, indicating the dawn of a new bull rally. However, amid the uncertainty in the crypto market, the sellers plunge the altcoin below the $103 level, suggesting a fakeout.
The aggressive traders who bought after the trendline breakout may have liquidated their coins, which intensified the selling momentum. As a result, the altcoin tumbled by 18.3% and slumped to the last quarter’s bottom support near $100.
The LTC price rebounded from this support level with a morning star candle, projecting a 7.57% gain. Traders who bought this dip can maintain a stop loss of around $94.9 or $84.5, depending on their risk appetite. The renewed bullish momentum may drive the altcoin to overhead resistance at $124.
Alternatively, if the sellers gave a decisive breakdown and candle closing below the $100 support, the altcoin could descend 30% to the $68.5 mark.
Technical indicator
Stochastic RSI: A positive crossover of the K and D line bolsters a bullish reversal from the $100 support.
DMA– The downsloping DMAs(20, 50, 100, and 200) reflect an overall bearish trend for the LTC/USDT pair. Moreover, a potential crossover between the 20 and 100 DMA may interrupt a steady recovery.
- Resistance level- $124 and $140
- Support levels- $100, and $90


