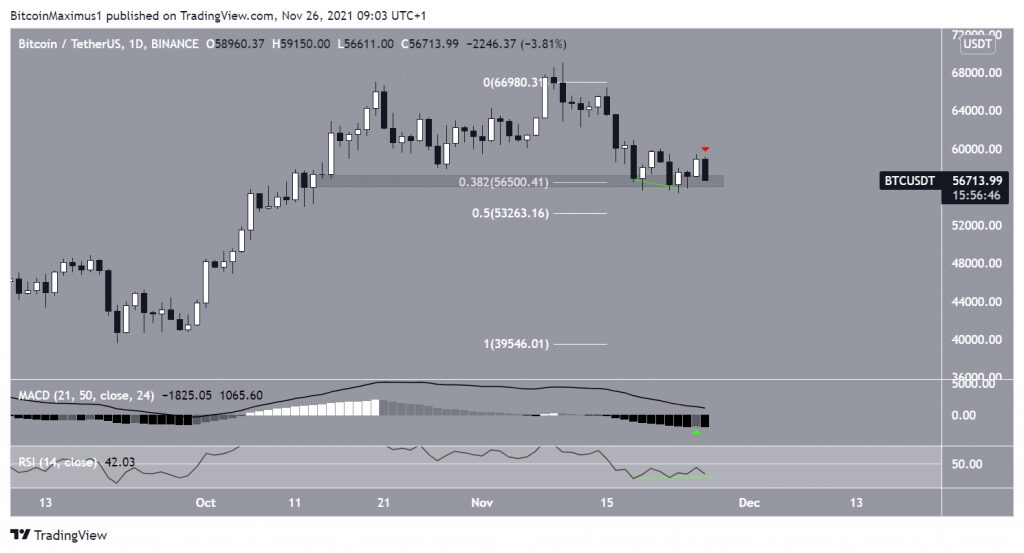
After initiating a bounce on Nov 25, Bitcoin (BTC) decreased considerably the next day and is back at its weekly lows.
Since Nov 19, BTC had been hovering above the $56,500 support. This is both a horizontal support area and the 0.382 Fib retracement support level.
Yesterday, technical indicators started to show some bullish signs.
After 15 successive lower momentum bars, the MACD finally created one higher (green icon). This was a sign that the short-term trend is gradually picking steam.
Furthermore, the RSI generated a bullish divergence (green line). This is a bullish occurrence in which a price decrease is not accompanied by the same increase in selling momentum.
However, BTC reversed its trend on Nov 26 and is in the process of creating a bearish engulfing candlestick (red icon). This is a type of bearish candlestick in which the entire previous day’s increase is negated the next day. There are still more than 15 hours until the daily close, but the start of the day looks extremely bearish.
If a breakdown were to occur, the next support area would be found at $53,250.
Short-term BTC movement
The six-hour chart shows that BTC has been decreasing under a descending resistance line since Nov 19. This is a sign that BTC is correcting.
Furthermore, BTC created a lower high relative to the price on Nov 20. This is considered a bearish sign since it didn’t have enough strength to reach its previous highs.
The even shorter-term two-hour chart shows that BTC is trading inside a symmetrical triangle and is very close to its support line, which coincides with the $56,500 horizontal support area.
Therefore, a breakdown from it would likely accelerate the drop.
Wave count
The wave count suggests that BTC is in the C wave (red) of an A-B-C corrective structure. This means that after the correction is complete, the upward movement is expected to resume.
The sub-wave count is shown in pink. It shows that BTC is in wave five of the correction, which is the final phase.
There is a considerable Fib confluence between $53,250-$53,800, created by:
- Length of sub-wave one (pink)
- External retracement of sub-wave four (white)
- Length of wave A (red)
These levels also coincide with the long-term Fib support outlined in the first section. Therefore, BTC is expected to reach a low in this area before reversing.
For BeInCrypto’s previous Bitcoin (BTC) analysis, click here.
Disclaimer
All the information contained on our website is published in good faith and for general information purposes only. Any action the reader takes upon the information found on our website is strictly at their own risk.


