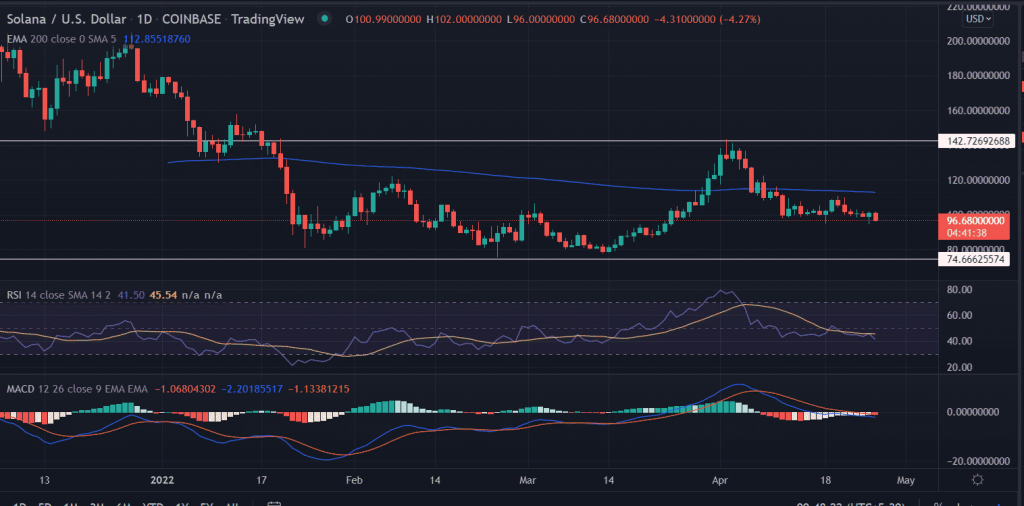
SOL price falters after witnessing gains in the previous session. The price has been stuck up in a short-term range for the past two weeks. However, the downside is well guarded near $100 morphing it into a crucial trading level.
- SOL price consolidating with predefined upside and downside boundaries.
- A move towards $130 is what investors are looking for provided a move beyond $110 hurdle.
- However, a daily close below $94.0 would make bears cheerful.
SOL price consolidates
On the daily chart, the selling pressure was structured amid market participants, which leads to profit-booking, and a correction in the SOL price since April 2. Looking back at the chart, the price surged nearly 78% from the lows of 77.0 made on March 13. In the process, the price attempted to break a consolidation that extends from January 19. But, the bulls remain unwilling to further extend the gains and fell back to the trading channel.
Now, the current price action suggests the SOL buyers harbor a crucial support zone around $95 to $100.0. If the bulls manage to give a daily close above $102, we expect a bounce back to the 200-ema (Exponential Moving Average) at $113.01.
An extended buying would bring $120 into play followed by the highs of April 5 near $136.
On the flip side, a spike in sell orders would take out the game from the bull’s hands. A failure to sustain the lows of April 18 near $94.0 will threaten the bullish outlook. In that case, the sellers have sight for $80.
Trending Stories
The relative strength index (RSI) is trading at 40. The oscillator slips below the average line on April 25, after hovering for a while.
As of writing, SOL/USD is exchanging hands at $97.15, down 3.80% for the day.


