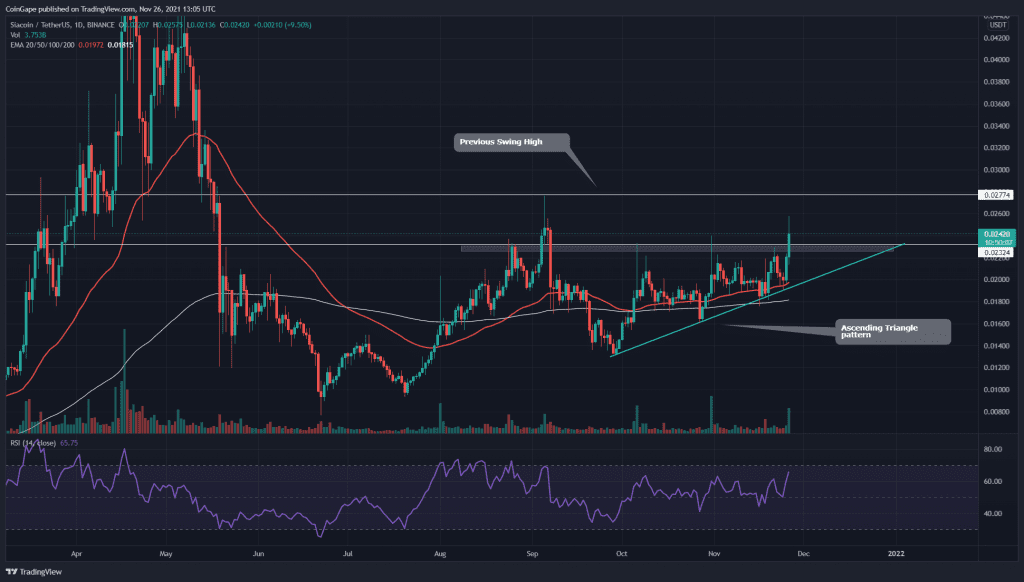
For the last six months, the SC coin price has been wavering in a sideways trend. However, after a long time, the technical chart finally gave new hope for the SC investors by forming an ascending triangle pattern. The price has already breached the neckline for his pattern, and sustaining this breakout should initiate a significant rally for the SC coin.
Key technical points:
- The SC coin gives a breakout from an ascending triangle pattern in the daily time frame chart
- The intraday trading volume in the SC coin is $496.9 Million, indicating a 352.3% gain
Source- SC/USD chart by Tradingview
Entering in October, the SC coin started a slow and steady recovery from the price fall of September. However, the coin price was experiencing absolute resistance from the $0.00234 resistance.
While making lower highs and rejecting the horizontal resistance, the SC coin formed an ascending triangle pattern, providing a great opportunity for crypto traders. Today, the price attempts to break out from this overhead resistance, with significant support from the volume activity.
The SC coin displays a bullish alignment in the crucial EMAs(20, 50, 100, and 200). Moreover, The Relative Strength Index(65) support the new rally by breaking a resistance level in its chart
SC/USD Chart In The 4-hour Time Frame

Source- SC/USD chart by Tradingview
The SC Coin price retraced back to retest this new support level and experienced a decent demand pressure present from it. The nearest resistance the price will face is the previous swing high at the $0.0277 mark, and the rising bullish momentum shows a good possibility of it happening.
If the coin manages to reclaim the overhead resistance as well, the price could resume its uptrend. The current price of the SC coin is $0.025, with an intraday gain of 15% .


