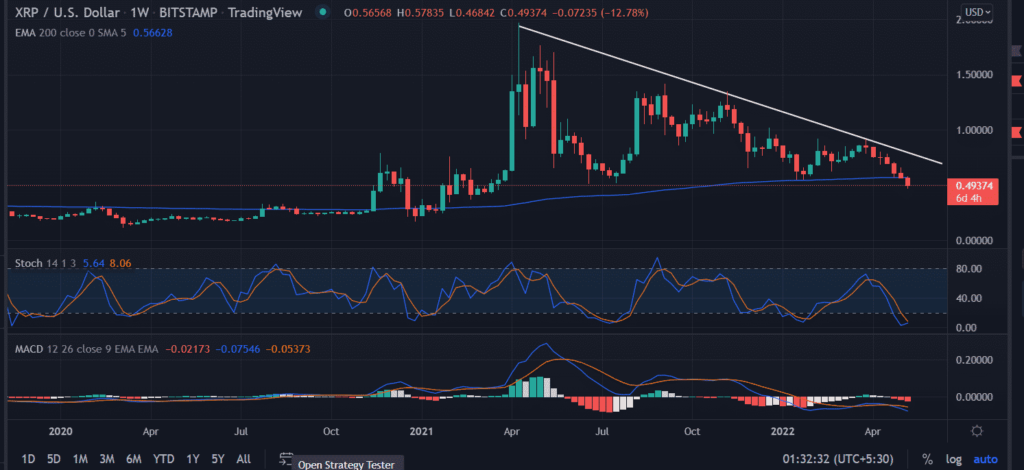
XRP price extends the slide on Monday with heavy selling volumes. The price looks bearish as it fell vertically on the daily chart. XRP collapses with no immediate support base, a fall below the current level would invite more sellers.
- XRP price trades lower with a heavy downside momentum on Monday.
- The lower side could be expected as the price slips below the 200-day EMA on the weekly chart.
- A daily candlestick above $0.60 would challenge the bearish outlook.
XRP price has no stoppage
XRP price is displaying intense selling pressure on the weekly-time frame. The price dropped 76% from the highs of April at $1.96, the descending trend line extending from the level acted as a resistance barrier to the bulls. The $1.40 remained a crucial level to trade as it formed a ‘double top’ formation. In addition to that, the bearish slopping line also makes the recovery a challenge for XRP.
Now, the price breaches the 200-day EMA (Exponential Moving Average) at $0.56 for the first time since January 2021. It could be the beginning of a new selling cycle with the bears targeting $0.40 followed by $0.20.
On the flip side, with a spike in buy orders owing to the oversold market structure, the price could recapture the session’s high. The change in the trend could only be possible above $0.70 on the daily basis.
As of press time, XRP/USD is exchanging hands at $0.47 down 15.16% for the day. The sixth-largest cryptocurrency by the market cap is held a 24-hour trading volume at $2,756,777,465 according to the CoinMarketCap.
Trending Stories
Technical indicators:
Stochastic oscillator: The bounded oscillator is in an oversold zone. An uptick in the indicator could result in a jump in the price.
MACD: The Moving Average Convergence Divergence fell below the midline with increasing downside momentum,


