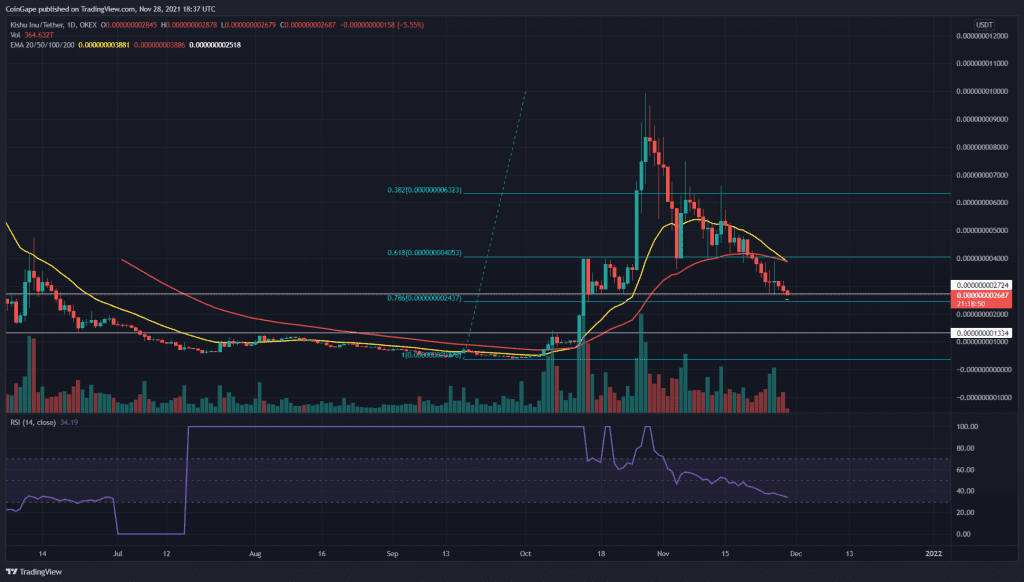
These last two months have been a roller coaster ride for the KISHU investors, wherein the token price experienced a parabolic growth in October, and later, with the same enthusiasm, the token price fell in November. The token price has dropped around 72.7% from its high and is plugged to a significant support level. Can bulls change the tides in their favor?
Key technical points:
- The KISHU token price plunged to 0.786 Fibonacci retracement level
- The 20-and-50 EMA line are on the verge of giving a bearish crossover
- The intraday trading volume in the KISHU token is $111 Million, indicating a 1.76% loss.
Source- KISHU/USD chart by Tradingview
The KISHU token initiated a parabolic growth in October, where the token price surged 2000%, making a month high at the $0.00000001 mark. Furthermore, the price was immediately rejected from this level, indicating a retracement phase in this chart.
However, the token price started dropping more than the expectations of the long traders, displaying a strong V-top reversal. Currently, the KISHU price is plunged to the crucial support zone of $0.0000000027-$0.00000000265, trying to sustain above this level. This support level is quite important for the crypto traders as it has a confluence with the other important technical level.
These technical levels are;
- A horizontal support level of 00.0000000027
- The token price is trying to sustain above the 0.789 FIB
- The presence of 200-day EMA.’
The Relative Strength Index(34) projects a bearish sentiment within the KISHU token.
KISHU/USD 4-hour Time Frame Chart

Source- KISHU/USD chart by Tradingview
It seems the KISHU token is strictly respecting the levels of a descending trendline. This resistance trendline has been leading the downtrend since early November. Thus, if the price bounces back from this bottom support, the crypto traders would get an early signal to go long.


