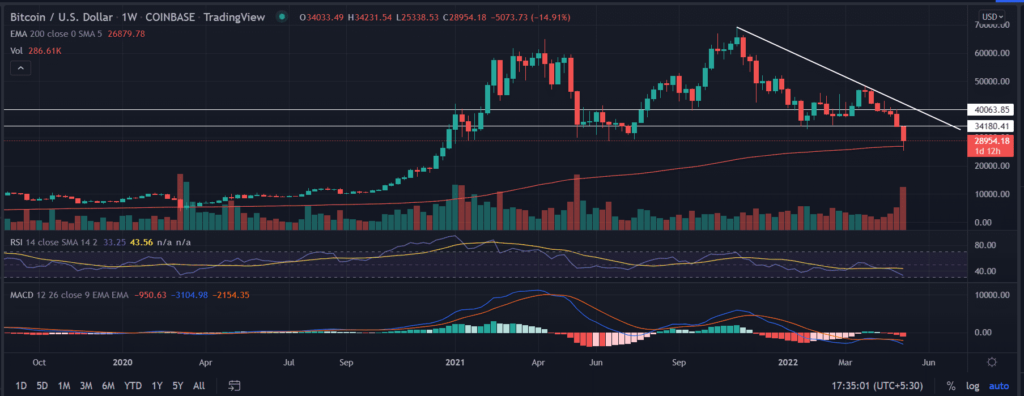
BTC price treads water on Saturday extending the consolidation of the last two sessions. The sellers seem exhausted near two-year lows. As the price quickly recovered back from the lows of Thursday with a gain of 5k points. In addition to that, a bullish formation on the weekly chart is looking for a minor upside.
- BTC price has made consolidate moves for the past three sessions following a massive sell-off.
- A bullish formation on the weekly chart calls for a relief rally in the pioneer currency.
- Oversold technical indicators suggest a minor bounce back before resuming the downside movement.
As of publication time, BTC/USD reads at $29,037.01, down 1.13% for the day. The 24-hour trading volume of the largest cryptocurrency holds at $34,478,093,119 with a loss of 35%.
BTC price remains vulnerable!
BTC’s price makes an attempt to recover but faces a strong upside hurdle in the last few session. BTC dropped 63% from the record highs made in November at $69,000. However, amid the oversold market structure, there is a fair chance of a recovery in the weekly time frame.
On the weekly chart, the BTC price tested the critical 200-day EMA (Exponential Moving Average) at $26,879.01 with the formation of a ‘hammer’ candlestick pattern. A sustained buying pressure would be required to push the price to pierce and tag the horizontal $34,000 mark.
An acceptance above $34,000 would ask for $40,000, the horizontal resistance zone.
Trending Stories
On the contrary, a spike in sell orders could push the price lower. Further, a daily candlestick below $25,000 would trigger a key level to amplify the selling toward December 2020 low, $18,000.
Technical indicator:
- RSI: The weekly relative strength index trades below the average line near the oversold zone. The same levels were last seen in March 2020.
- MACD: The moving average convergence divergence holds below the midline with a bearish bias.


