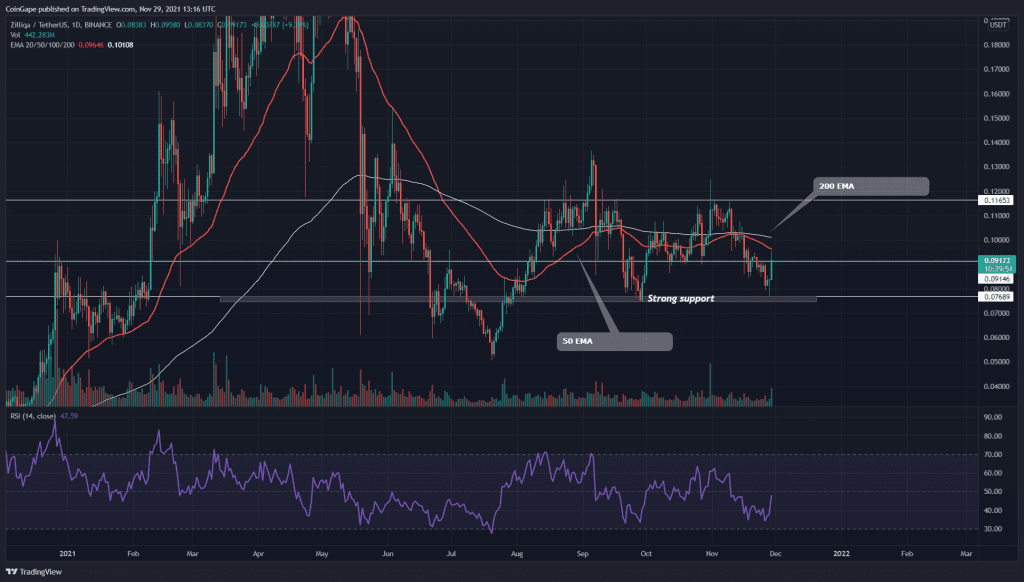
For more than two months, the RAY token price retested the crucial support of $9.1 multiple times, indicating the presence of intense demand pressure below this level. As for now, the token price is again trying to bounce back from this bottom level, and this time with the help of bullish divergence in RSI, will the RAY token initiate a significant rally from here?
Key technical points:
- The RAY token price trying to reclaim the 50-day EMA
- The daily RSI chart indicates a bullish divergence for RAY price
- The intraday trading volume in the RAY token is $146.7 Million, indicating an 86.5% loss.
Source- RAY/USD chart by Tradingview
Since the sudden fall in September, the RAY token price was wavering around the support level of $9.1. This is an important support level for the bulls, and all the attempts of sellers trying to drop the price lower were stopped by this level.
After the recent support the price took from this bottom level, the Relative Strength Index(51) displayed a bullish divergence in its chart, suggesting the market buyers are growing in strength.
Furthermore, the ZIL token price is currently trading at $10.5 and is 18% up from this bottom support level. The price is currently trying to cross above the 50 EMA line, which should provide even more confirmation for the traders.
RAY/USD 4-hour Time Frame Chart

Source- RAY/USD chart by Tradingview
The technical chart of the RAY token indicated a double bottom pattern in the 4hr time frame chart. The token price is currently at the doorstep of the $10.5 neckline of this pattern, and a breakout from this resistance should provide a great long opportunity for crypto traders.
According to traditional pivot levels, the crypto traders can expect the next resistance at $10.68, followed by $11.36. As for the opposite end, the support levels are $9.8 and $9.1.


