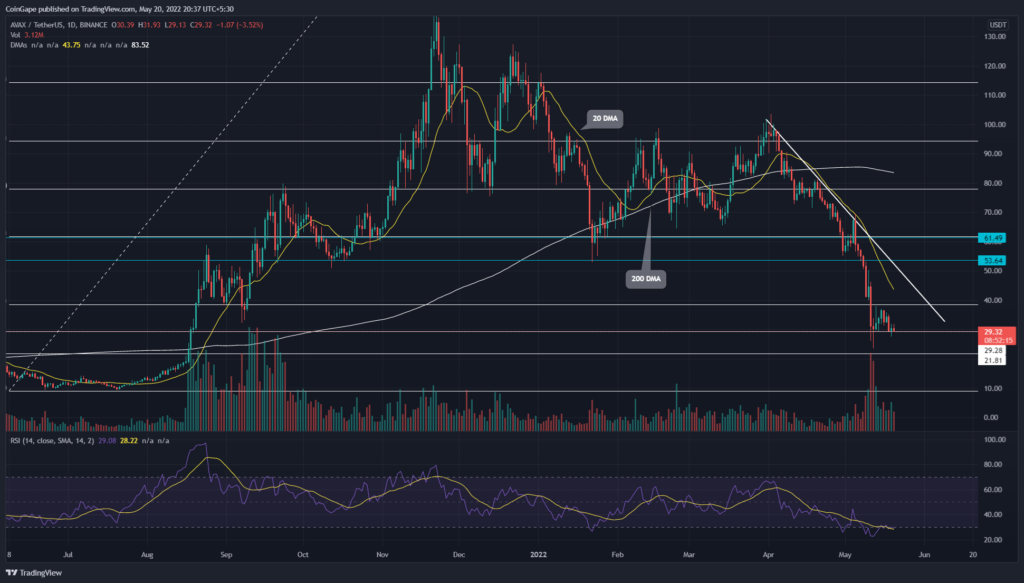
On May 12th, the ongoing correction in Avalanche(AVAX) price marked a new low of $23 and managed a daily candle closing above $30. Furthermore, the resulting lower price rejection indicated the demand pressure from below and halts charging bears. Moreover, a second retest to this fresh is expected to initiate a minor bullish pullback.
Key points:
- The AVAX chart presents strong support $30
- AVAX recovery needs a breakout from descending trendline
- The intraday trading volume in the AVAX is $844 Million, indicating a 3.2% gain
Source- Tradingview
On April 2nd, the Avalanche(AVAX) price reverted from its three-month high of $103.6 and triggered a new bear cycle. The downfall witnessed occasional 10-20% pullbacks and dropped to the multiple-month support of $53.6.
Furthermore, the early May sell-off accelerated the selling pressure and breached the bottom support on May 2nd. The post-retest downfall extended the correction rally by 55% and reached a new lower low of $23.55.
However, the buyers sustained the AVAX price above the $30 psychological level and a double retest to this support within a week, indicating strong demand pressure.
Trending Stories
Therefore, a potential rally may rechallenge the 40% high resistance of the descending trendline and the subtle bullish divergence on the RSI indicator only adds to the cause.
Alternatively, a daily-candlestick closing below the $30 would invalidate the bullish thesis and continue the correction rally 26% lower
Technical indicator
EMAs- Since the recent bearish crossover among the 100-and-200-day EMA, the AVAX price has maintained a bearish sequence between the crucial EMAs(20, 50, 100, and 200). The expected pullback would first face resistance from 20-day EMA near $40
RSI- A bullish divergence at the oversold region of the daily-RSI chart reflects the overextended correction phase and the need for bullish recovery.
- Resistance levels- $38.3, and $53
- Support levels- $30 and $22


