The inaugural edition of ARK ’s “The Bitcoin Monthly” report contains some gems. It also contains a simple compilation of facts that paint a clear picture of the bitcoin market as it currently stands. A blockchain is an unalterable fountain of evidence, and ARK put their best analysts to review it in-depth and get stats and insights for us. Get some coffee and take a seat, let’s forget about the Fear & Greed index and see what the numbers are really saying.
Excited to introduce the first official issue of “The Bitcoin Monthly”
Starting this month, ARK will be publishing an in-depth report covering Bitcoin’s market action and sharing where we think the market’s headed.
Here are the major highlights from this month’s report:
— Yassine Elmandjra (@yassineARK) June 3, 2022
Over at Twitter, ARK Analyst Yassine Elmandjra described “The Bitcoin Monthly” as: “Starting this month, ARK will be publishing an in-depth report covering Bitcoin’s market action and sharing where we think the market’s headed.” On ARK’s website, they describe the new venture as: “Considering the market’s fast pace of change, ARK publishes The Bitcoin Monthly, an “earnings report” that details relevant on-chain activity and showcases the openness, transparency, and accessibility of blockchain data.”
Related Reading | Bitcoin Price Closes Two Consecutive Weekly Red Candles, First Time Since Bottom
Let’s check the data and insights available in May’s edition.
The State Of The Bitcoin Market, With ARK
According to “The Bitcoin Monthly”:
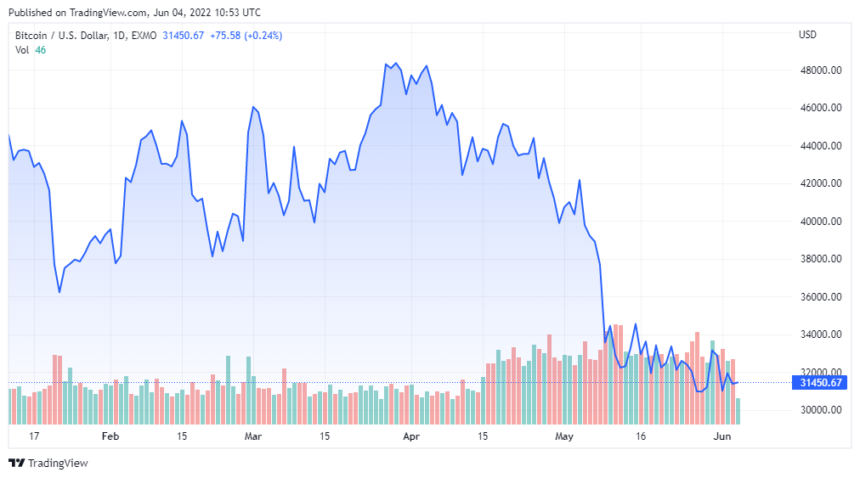
- “Bitcoin closed the month of May down 17.2%, declining from $38,480 to $31,835.”
Let’s be honest, this looks like the beginning of a bear market. And the Terra/ Luna crash appears to be the catalytic event. However, subsequent data will show that we might not be in one after all.
- “Bitcoin closed the month down 17.2%, printing its ninth consecutive negative weekly decline for the first time in history, suggesting a possible oversold condition.”
Nine consecutive red candles, a new record. That’s a horrific fact no matter how you dress it. However, according to ARK, it suggests “a possible oversold condition.” Which is promising.
- “Bitcoin is down 57% since reaching an alltime high in November 2021. For perspective, the average peak-to-trough drawdown during previous bear markets stands at 76%.”
Does this mean things could get worst? Or does it mean we’re not near bear market levels? It definitely feels bear-markety, but the stats are the stats.
BTC price chart for 06/04/2022 on Exmo | Source: BTC/USD on TradingView.com
The Bitcoin Network Stands Strong
- “Despite the continued sell-off, bitcoin has not broken below any major trendline. It is trading above its onchain cost basis at ~$24,000 and its 200- week moving average at ~$22,000.”
The bitcoin network absorbed Terra/Luna’s massive sell-off and the market’s subsequent one like a champ. The worst seems to be behind us and bitcoin “has not broken below any major trendline.”
- “An all-time of nearly 66% of bitcoin’s supply has not moved in over a year, a testament to the market’s longer-term focus and a holder base with stronger conviction.”
Despite the massive market movement, bitcoiners keep HODLing like it’s the only chance at economic freedom that they’ll see in their lifetimes. Because it is.
- “Short-term holder positions fell -35% below their breakeven price, on average.”
If bitcoiners are HODLing, who’s selling all those cheap sats? Short-term holders, that’s who. And they’re not even close to breaking even. It’s a short-term holders massacre out there.
ARK Sees A Way For The Market To Jumpstart Itself
Look, hear ARK out. First of all, “bitcoin’s open interest in the futures market has reached an all-time high of approximately 450,000 BTC.” Also, “perpetual contract basis typically hints at market direction. Currently, it is trading at a bullish discount to spot.” This is very important because, “given the high open interest outstanding, we believe the perpetual futures discount indicates a potential upward trajectory in BTC’s next major price movement.”
Related Reading | Revisiting Dorsey’s Hyperinflation Tweet: Elon, Wood, Saylor, Balaji, Chip In
That’s right, ARK closes “The Bitcoin Monthly” report predicting “a potential upward trajectory.”
Featured Image by Ricardo Gomez Angel on Unsplash | Charts by TradingView


