Disclaimer: The findings of the following analysis are the sole opinions of the writer and should not be considered investment advice.
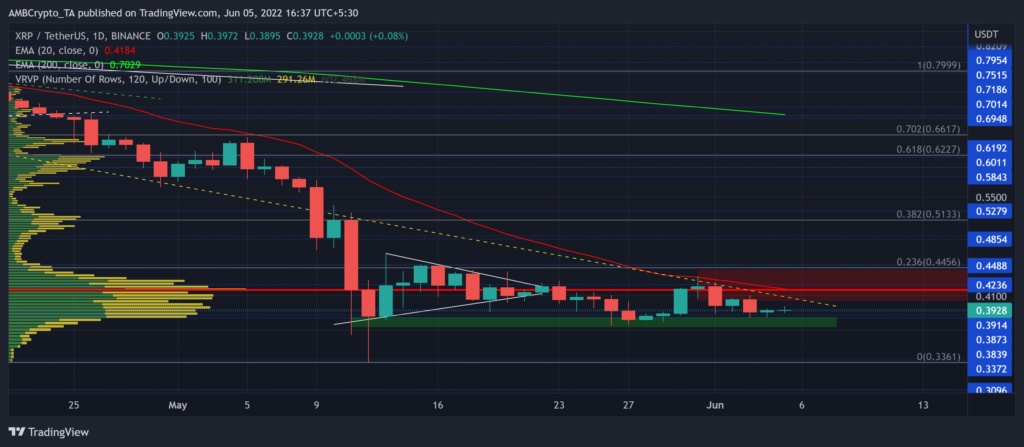
With the 38.2% and the 23.6% Fibonacci levels depriving the bulls of their buying vigor, XRP flipped its 11-week trendline support (yellow, dashed) to immediate resistance.
As the sluggish phase continues, the altcoin is testing the $0.38-baseline that the buyers have held for over a year. A close below the immediate demand zone (green) would provide shorting opportunities.
However, if the buyers recoup snap the $0.42-resistance, XRP could see a rebound above its Point of Control (POC, red). At press time, XRP traded at $0.3928.
XRP Daily Chart
While the extended bearish rally finally halted, XRP is entering a tighter phase near its POC. For over two months, buyers have not had an opportunity to spur a streak of green candles and provoke a revival phase.
After poking its 15-month low at the $0.33-level on 12 May, XRP has been hovering near its demand zone. A continued compression between the trendline resistance and demand zone could confirm a descending triangle on the Daily timeframe.
Any close below the immediate baseline would give sellers enough thrust to open a door toward the $0.33-zone.
However, the distance between the 20 EMA (red) was over-extended from its 200 EMA (green). After this record-high gap, the buyers would be keen to step in and trigger a rally. A close beyond the $0.418-level could expose XRP to an upside toward the 23.6% Fibonacci resistance.
Rationale
The Relative Strength Index (RSI) was in compression near its oversold region. The bulls still needed to topple the 41-resistance to enable a robust recovery in the coming times.
Also, the OBV was struggling to counter its immediate resistance whilst conforming to the bearishness.
Further, until the Aroon up (yellow) sustains itself above the 70%-level, the chances of a bull run seem relatively slim.
Conclusion
The alt’s drop toward its long-term support has mainly opened up two opportunities for the traders/investors.
A potential bounce-back could pave a path for a test of the 23.6% level. Whereas a fall below the demand zone would give a shorting opportunity with a take-profit level in the $0.3-zone.
Even so, keeping an eye on Bitcoin’s movement and the broader sentiment would be important to complement the aforementioned analysis.


