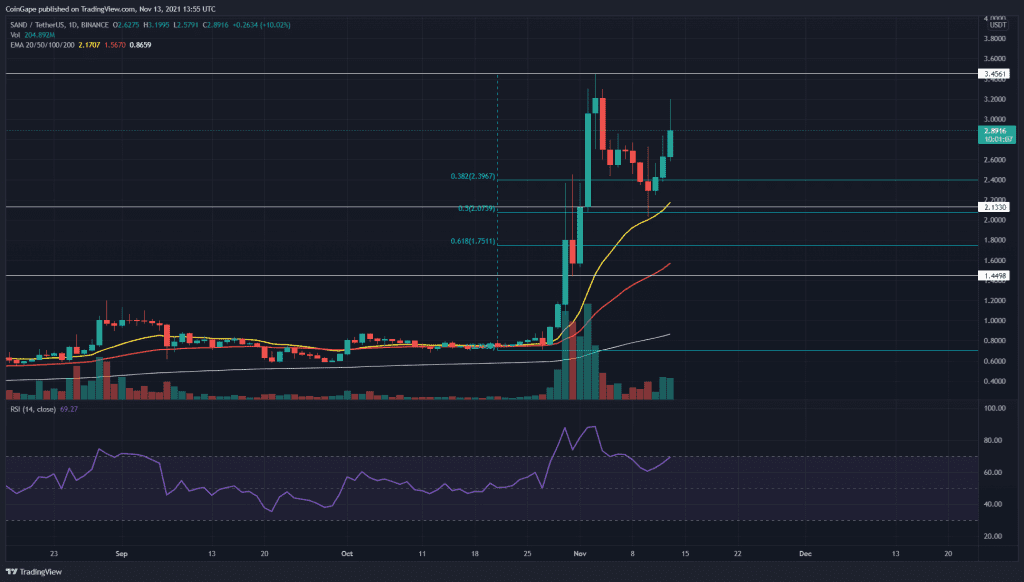
The Metaverse token like SAND was having a short break after it gave a remarkable rally, driven by the Facebook announcement of rebranding to ‘META.’ The technical outlook for SAND/USD is super bullish, and it seems the token wants to again challenge the $3.45 level. will it go beyond this level?
Key technical points:
- The SAND token price obtaining good support from the 20-day EMA
- The daily RSI chart showed a significant drop in its value
- The intraday trading volume in the SAND token is $2.5 Billion, indicating a 56.3% hike
Source- SAND/USD chart by Tradingview
On November 3rd, the SAND token made a New All-Time High of $3.45. The token price needed to stabilize this sudden rally and thus, initiated a minor retracement phase. The SAND price plunged to the Fibonacci retracement level of 0.5, which provided sufficient support to this token.
As for the crucial EMA’s(20, 50, 100, and 200 ), the token presents a strong uptrend, where the 20 EMA line is currently providing good support its price.
The Relative Strength Index value is at 68 and has shown a considerable fall concerning the minor pullback of the price action.
SAND/USD Chart In The 4-hour Time Frame

Source- SAND/USD chart by Tradingview
The SAND token bouncing from the 0.5 FIB indicates a reasonable possibility of the price continuing its rally. The token price also managed to reclaim a minor horizontal resistance of the $2.77 mark, and the price might retrace back to retest this level.
The MACD Indicator shows both its line have recently jumped above the neutral zone(0.00), indicating a switch to the bullish momentum in this token. The token price is currently trading at the $3.34 mark with an intraday gain of $25.3%.


