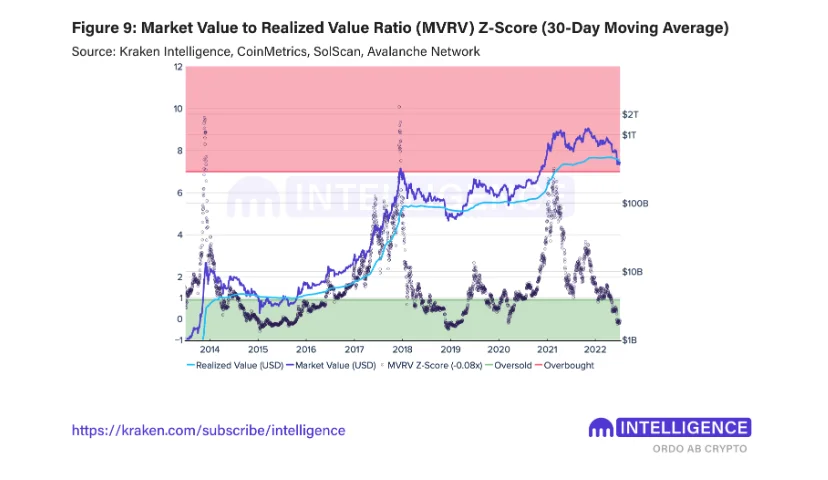
- Bitcoin’s MVRV z-score dropping under zero suggests that Bitcoin is deep in the oversold territory.
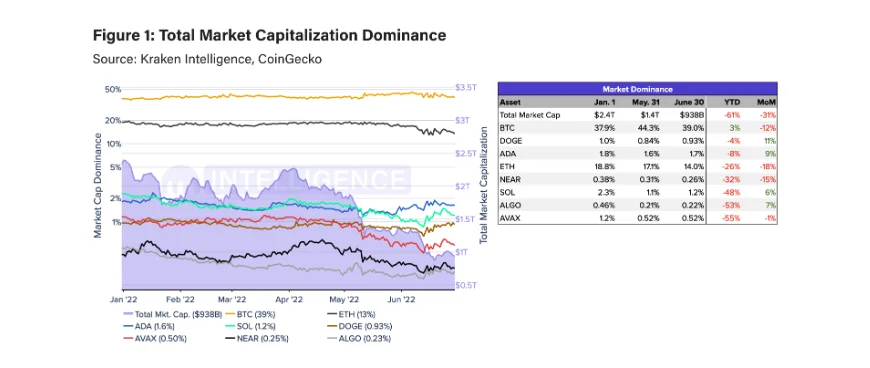
- Bitcoin is the only cryptocurrency, among top players, whose market dominance has surged. Avalanche sees the most drop in market dominance.
Amid solid crypto market correction during the second quarter of 2022, the market sentiment has turned extremely bearish. As the global macro environment remains extremely weak, the broader market opinion remains pessimistic. A majority of Wall Street investors are expecting Bitcoin to correct another 50 percent from the current price to $10,000.
Cryptocurrency exchange Kraken has recently published its new report explaining what lies ahead in the crypto market for this month. The Kraken Intelligence report shares several on-chain fundamentals for Bitcoin and cryptocurrencies and where they stand in the current market scenario.
After holding up above $20,000 levels last week, Bitcoin (BTC) has come once again under selling pressure. For the last few weeks, Bitcoin continues to trade under its 200-day exponential-moving average (EMA). It means this could be a good point of accumulation for long-term investors.
Also, Bitcoin’s market value to realized value (MVRV) z-score shows that the world’s largest cryptocurrency is trading in the oversold territory. After the recent correction, Bitcoin’s MVRV z-score has dropped under 0. It means that BTC is deep in oversold territory and historically, this has acted as strong support.

Courtesy: Kraken Intelligence
If the MVRV z-score breaks into the neutral region above 1 along with BTC price rebounds, and holds there, it would mean that the network demand is rising. The Kraken report mentions:
Although BTC’s MVRV z-score still has room to fall before reaching the lows recorded during the bear markets of 2015, 2018 and 2020, its current reading is rapidly approaching the lows recorded in March 2020 when BTC fell to $3,900 during the initial phases of the COVID-19 pandemic.
Let’s take a look at other on-chain metrics that Kraken explains.
Total market cap dominance
A look at the total market dominance gives us insights into the rise or fall in demand for crypto assets. Furthermore, comparing the BTC price to other altcoins helps us identify how dominance shifts relative to BTC price performance.
Bitcoin (BTC) is the only cryptocurrency among the top players which has seen its market dominance surge year to date. This is because even the topmost altcoins have experienced even steeper corrections in comparison to Bitcoin. Take a look at the below chart to understand the overall picture.

Courtesy: Kraken Intelligence
Avalance (AVAX) witnessed its market cap dominance collapsing the most by 55 percent. This was because the LUNA Foundation Guard (LFG) had over 2 million AVAX tokens in its treasury. During the collapse of the Terra ecosystem, LFG had to liquidate all of its AVAX reserves.
Whi;e Ethereum’s dominance dropped by 26% other Layer-1 competitors like Solana (SOL) faced an even steeper drop of 48%. Cardano (ADA) has been holding relatively well with market dominance tanking by 8%.
Blockchain transaction fees
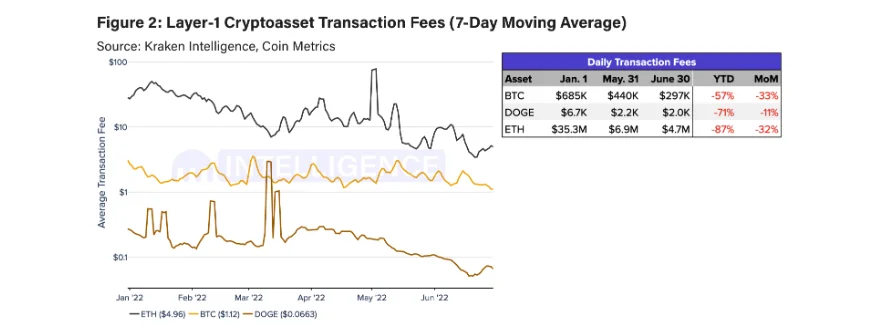
Transaction fees help us in understanding the market demand. They indicate the costs that market participants are willing to pay to include a transaction. Some blockchain networks like Solana, Algorand, and Cardano, have static fee rates. However, for blockchains like Bitcoin and Ethereum, the transaction fee varies as per demand. As per the Kraken data, there’s a steep fall in the transaction fee of Bitcoin and Ethereum.

Courtesy: Kraken
Despite a 57 percent drop in transaction fees, it is still relatively less in comparison to Ethereum facing an 87 percent drop. This shows that Bitcoin network demand continues to remain relatively strong.
Daily adjusted settlement value and daily active addresses
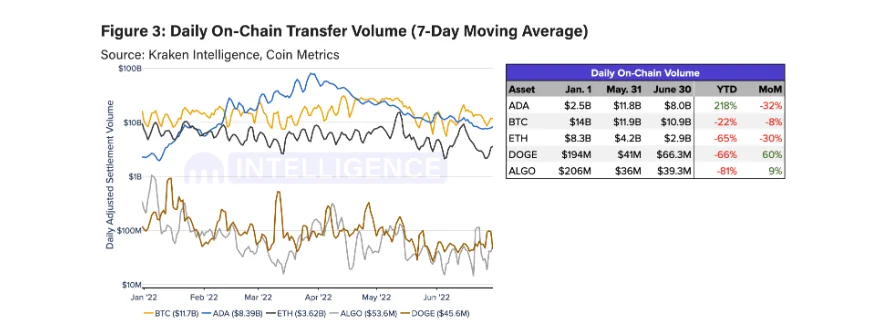
The network transaction volumes are a key on-chain metric to get the idea of active users and the network demand. While daily transaction volumes have been on a decline this year for most of the top blockchains, it has been on the rise for Cardano (ADA).

Courtesy: Kraken
Cardano (ADA) has seen on-chain transaction volume surge by 218 percent this year in 2022. There have been several notable developments taking place on the Cardano blockchain. The launch of DeFi exchange SundaeSwap has also contributed to increased on-chain transaction volume. However, there’s no specific growth driver behind the surge in on-chain transaction volume.
The daily active addresses help us understand the network demand among new market participants. The growing number of daily active addressed underscores strong demand. Among all blockchain networks, Solana takes a massive lead with 87 percent in daily active addresses. On the other hand, Bitcoin’s daily active addresses have surged only 3 year-to-date.

Courtesy: Kraken
Circulating supply growth
The circulating supply growth for any cryptocurrency helps us evaluate its on-chain liquidity. As per Kraken: “The metric includes that tokens have been unlocked from vesting and/or minted by the protocol”. This data point helps us understand the supply dynamics of a crypto asset. “An influx of immediately marketable supply can pressure market activity,” says Kraken.

As we can see from the above metric, NEAR protocol has been leading with circulating supply growth standing at 20 percent. The next comes Avalanche (AVAX) followed by Solana (SOL).
All these on-chain indicators put a clear view on how the blockchain networks have been performing during the strong bearish sentiment. While the market sentiment has tanked to the negative, some long-term holders continue to put their faith in Bitcoin and Ethereum.


