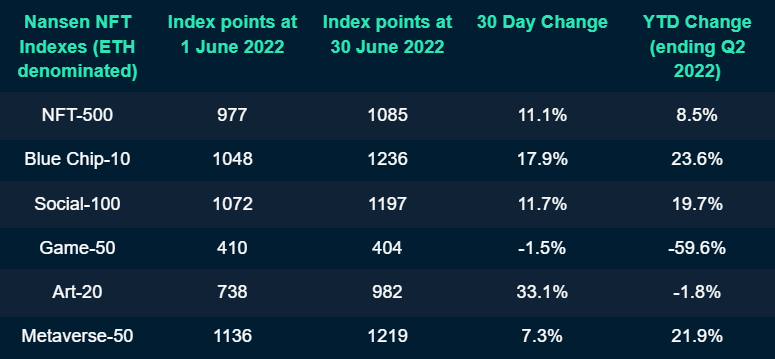
In a newly published report, popular analytics platform Nansen assessed the performance of the NFTs market in the second quarter of the year.
Using its NFT indexes, Nansen found that blue chip NFTs recorded an uptick in sales volume in June despite having a gloomy quarter. In the last quarter, there was a significant development of NFTs as a sector, as a review of the monthly returning and first-time buyers of NFTs on ETH revealed continued growth in market participants actively buying NFTs.
Blue Chip NFTs took the lead
Noting the impact of macroeconomic factors on the performance of the general cryptocurrency market and an initial decline in sales volume for most NFT projects, Nansen, in its report, found that at the end of the last quarter, all NFT sectors apart from Gaming NFTs posted a recovery.
Taking a cue from its Blue Chip-10 (ETH) index, Nansen stated that Blue Chip NFTs led this bounce as early as 5 June.
“Blue Chip-10 index reported an increase of 23.6% at the end of Q2, leading the NFT market. In June alone, the Blue Chip-10 index reported a 17.9% increase in the 30 days.”
Art NFTs for the win
Moreover, Nansen stated that of all the NFT sectors, which include art NFTs, gaming NFTs, social NFTs, and metaverse NFTs- art NFTs saw the most significant recovery in June following the bearish run that plagued the second quarter.
It found that art NFTs registered a 33.1% increment in sales volume in June. The analytics firm added further that Generative Art NFTs accounted for most (92%) of the Art-related NFTs in the index.
How did the NFT-500 (ETH) perform?
The NFT-500 (ETH) is a Nansen index designed to track the market activity of the top 10 NFT collections, weighted by market capitalization.
In the last quarter, Nansen found that the market capitalization of social NFTs amongst the NFT-500 (ETH) registered a growth. In contrast, that of gaming NFTs decreased.
Measuring the ratio of buyers to sellers’ wallets who transacted the NFT collections within the NFT-500 (ETH) index in the last quarter, Nansen found that the number of buyers dropped at the end of May.
However, the ratio recovered slightly in June and “and remained relatively stable” by the end of the quarter.
As per data from NFTGO, the last quarter was marked by a 37.34% decline in total NFTs market capitalization. Also, sales volume saw a 67.75% decline within the same period.


