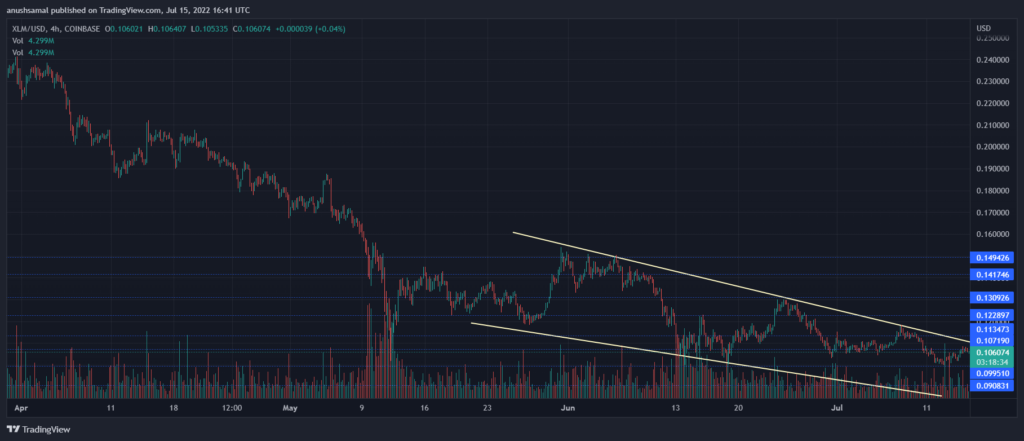
Stellar (XLM) picked up pace on the daily chart as the coin registered some upward movement. The coin has been trading within a descending channel. Although the coin was moving sideways, if bulls reclaim the chart XLM can break above the channel.
Technical outlook for the coin remained bearish. Buying strength also remained considerably low. Recent sell off in the market has caused the coin to lose its $0.107 support line. If the coin does not rise above the resistance mark of $0.107 then the altcoin is set to lose some of its value again.
Buying strength has to recover in the market for the altcoin to break over the descending trendline. For bearish thesis to be invalidated, it is important for Stellar to trade above the $0.113. For Stellar to maintain its recovery, buying strength needs to immediately re-enter the market. The global cryptocurrency market cap today is $968 Billion with a 2.0% positive change in the last 24 hours.
Stellar Price Analysis: Four Hour Chart
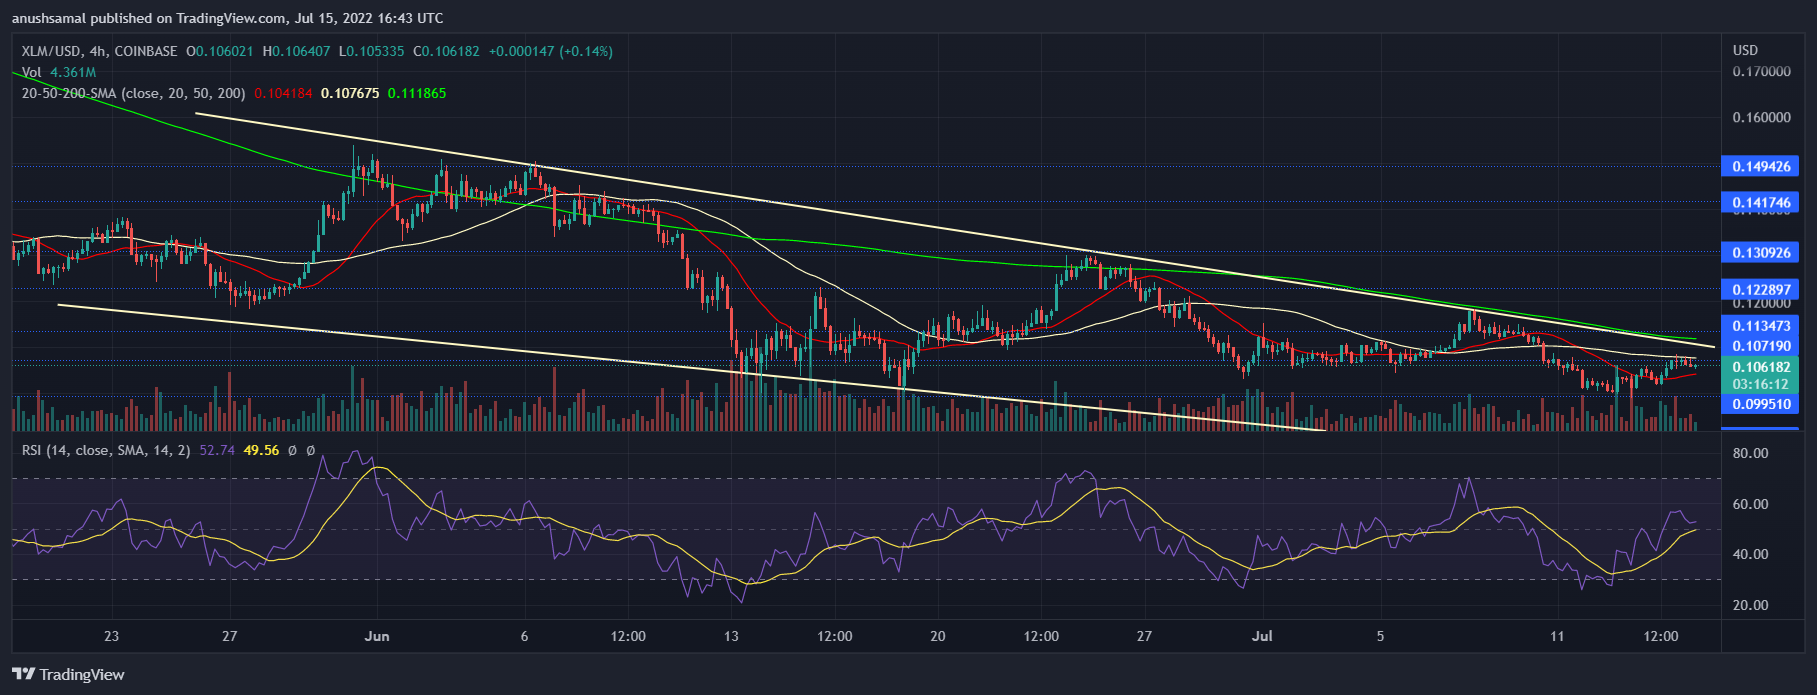
XLM was trading for $0.106 at the time of writing. The coin tried to rise above the descending line but fall in buying strength have dragged price below the $0.107 mark. If the coin manages to trade above the $0.107 mark, then it could revisit $0.113.
Trading above the $0.113 level will help the bearish thesis to be invalidated. If XLM loses its current price level, it could fall to $0.099. The amount of Stellar traded fell on the chart signifying less buying strength. If buying strength continues to remain low then the coin can plunge through the $0.099 level.
Technical Analysis

The altcoin flashed fall in buying strength as seen from the technical indicators. Relative Strength Index was trading close to the half-line after noting a downtick. This downtick meant buyers exited the market. If buying pressure continues in this momentum, RSI will soon fall below the zero-line.
Price of Stellar was slightly above the 20-SMA which pointed towards buyers driving the price momentum in the market. Although buyers are still more in number compared to sellers, it isn’t enough for the coin to register increased price over the upcoming trading sessions.
Related Reading | Short Liquidations Climb As Bitcoin Recovers Above $20,000

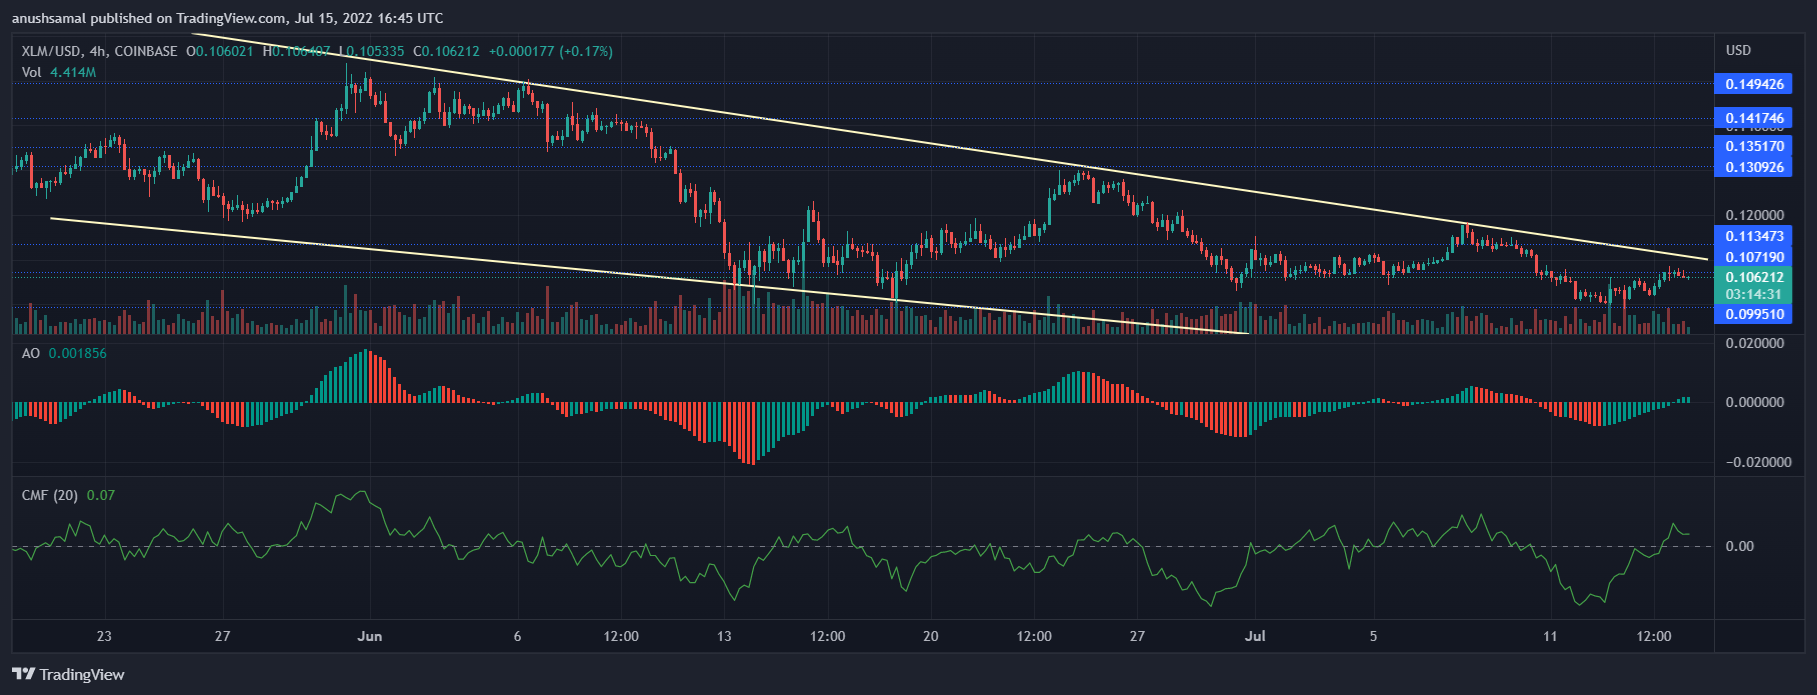
XLM’s buying strength has remained low on the chart. In consonance with the same, Chaikin Money Flow which depicts capital outflow and inflows displayed a downtick. Although CMF was positive, capital inflows have remained low.
Awesome Oscillator points towards price direction and momentum. AO turned positive and displayed green histograms. These green histograms reflected change in price direction and also a buy signal. Despite a buy signal, if buyers don’t act on it then Stellar’s upward movement will be stalled.
Related Reading | Bitcoin Funding Rate Turns Highly Positive, Long Squeeze In The Making?
Featured image from VOI.ID, chart from TradingView.com


