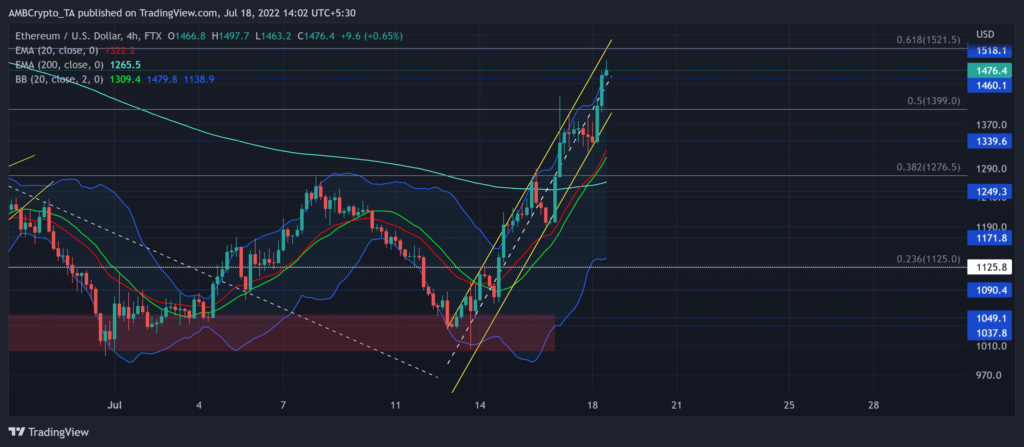
Over the last five days, Ethereum [ETH] saw a revival from its month-long demand zone in the $1,049 zone. The streak of recent green candlesticks has transposed ETH into a near-term bullish control.
The consistent recovery efforts deployed by the buyers have helped ETH breach the bonds of the 38.2%, and 50% Fibonacci levels.
As this phase progresses, a potential rebound from the golden Fibonacci level could ease the immediate buying pressure. At press time, ETH traded at $1,471, up by 8.02% in the last 24 hours.
ETH 4-hour Chart
ETH’s Bollinger Bands (BB) have revealed a one-sided bullish edge while the price was hovering near its upper band. The alt’s close above the basis line (green) of the BB opened doorways for this steep recovery.
During its previous decline phase, ETH lost more than half its value in just nine days (from 10 June). As a result, the alt gravitated toward its 17-month low on 19 June.
However, the bulls quickly ensured the $1,049-zone demand zone and propelled an up-channel (yellow) revival in the 4-hour timeframe. Meanwhile, the 20 EMA (red) jumped above the 200 EMA (cyan) to reflect the heightened bullishness.
A rebound from the 61.8% level can help the bears retest the $1,390 mark. Any breakdown from the up-channel could further propel a retest of the north-looking 20 EMA before a likely revival.
Rationale
The Relative Strength Index (RSI) took an overbought position in this timeframe. As the index rose toward the 80-mark, a likely reversal from this level can affirm near-term ease in buying power.
Also, the Volume Oscillator (VO) marked lower peaks during the recent gains and affirmed a bearish divergence with price. To top it up, the CMF also chalked out a similar trajectory and saw this divergence.
Conclusion
Owing to the 61.8% level hurdle alongside the bearish divergences on the indicators, ETH could see a near-term slowdown before picking itself up again. The targets would remain the same as discussed above.
Finally, investors/traders need to watch out for Bitcoin’s movement. This is because ETH shares a whopping 81% 30-day correlation with the king coin.


