Published 52 mins ago
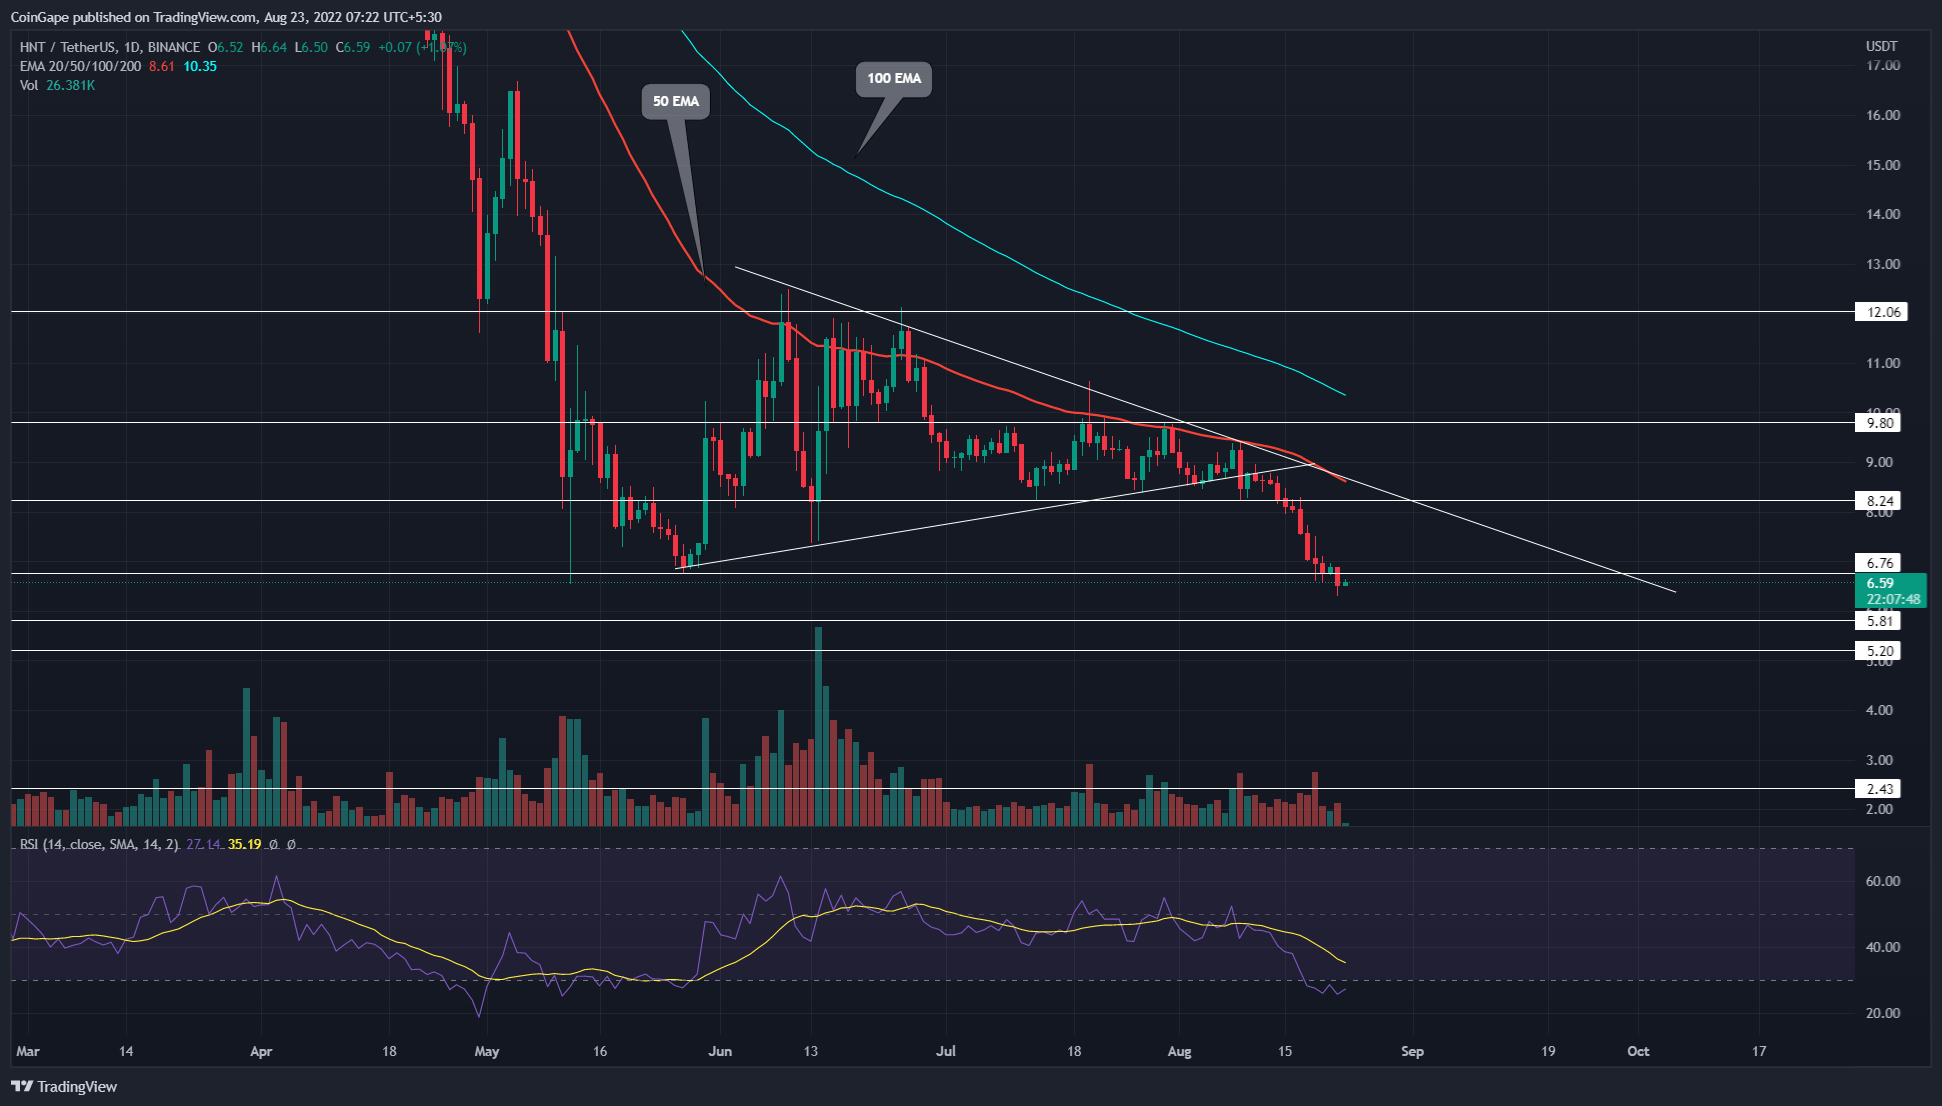
The symmetrical triangle pattern breakout triggered a drastic fall, plummeting the HNT price May low of $6.76. In addition, as the Crypto markets continue to suffer under a bearish cloud the coin price bridged this bottom support indicating a new 2022 low will be formed for Helium
advertisement
Key points from HNT analysis:
- The HNT chart shows a high Momentum breakdown from the %6.7.
- Low volume retest offers an entry opportunity for interested short-sellers
- The intraday trading volume in the Helium coin is $7.2 Million, indicating a 40 gain.

Source- tradingview
While several cryptocurrencies showed phenomenal growth in June and July, the HNT price kept wavering in a sideways rally. Furthermore, this price consolidation displayed the formation of a symmetrical triangle pattern in the daily time frame chart.
In theory, this continuation pattern triggers a direction rally when the price gives a suitable breakout from either trendline. Therefore, the recent upsurge in selling pressure triggered a bearish breakdown from this pattern.
Trending Stories
The post-retest fall showcased ten consecutive red candles and plunged the HNT price by 24.7%. Thus, with sustained selling, altcoin slumped to the May low support of $6.75.
Starting the new week, the HNT price breached this bottom support indicating the continuation of the prevailing downtrend. Thus, the daily candlestick closing will allow sellers to test the $6.75 level as potential resistance.
If the coin price sustains below the $6.75 mark, the resulting downfall may plummet 22.5% lower to hit the next significant supply zone of $5.23.
Moreover, if the price shows some in-between bullish pullback, the trendline may assist sellers in maintaining this downward trend.
On a contrary note, closing above the resistance trendline will give an early sign of recovery.
Technical indicator
Relative Strength Index: The daily-RSI slope dived into the oversold region along with the support breakdown. The indicator value is so low, indicating a possibility of a bullish pullback.
advertisement
EMAs: The downsloping 100-and-200-day EMA accentuates an overall bear trend. Moreover, the 50-day EMA acts as dynamic resistance for HNT price.
- Resistance levels- $6.76 and $83.24
- Support levels are $5.8 and $5.2
Share this article on:
The presented content may include the personal opinion of the author and is subject to market condition. Do your market research before investing in cryptocurrencies. The author or the publication does not hold any responsibility for your personal financial loss.


