On-chain data suggests the Bitcoin Long-Term Holders are currently putting more selling pressure on the market than short-term holders.
Bitcoin Long-Term Holder SOPR Has Spiked Up In Recent Days
As explained by an analyst in a CryptoQuant post, Short-Term Holders and US investors haven’t sold as much lately as during the start of June.
The relevant indicator here is the “Spent Output Profit Ratio” (SOPR), which tells us about whether investors in the Bitcoin market are selling at a profit or at a loss right now.
When the value of this metric is greater than 1, it means the average holder is moving their coins at some profit at the moment.
On the other hand, the indicator’s value being less than the threshold implies the market as a whole is currently realizing some loss.
There are two popular categories of Bitcoin investors, the “Short-Term Holders” (STHs) and the “Long-Term Holders” (LTHs).
The former holder group includes all those investors who have been holding their coins since less than 155 days ago, while the latter cohort is made up of the hodlers who have had their coins sitting still since more than that.
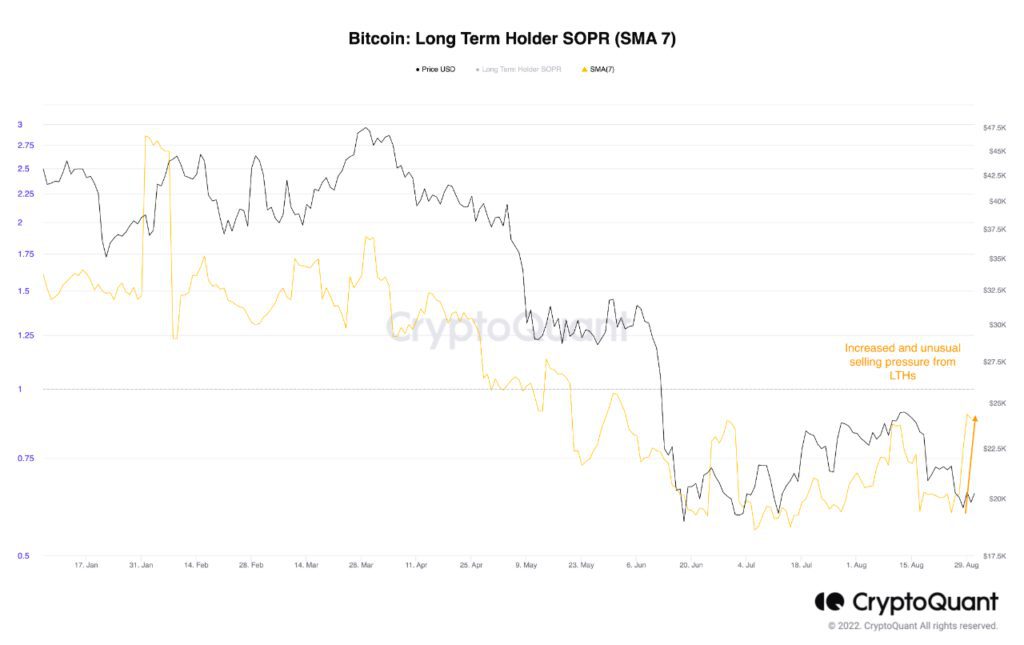
Now, here is a chart that shows the trend in the Bitcoin SOPR specifically for the LTHs:
The 7-day moving average value of the metric seems to have risen in recent days | Source: CryptoQuant
As you can see in the above graph, the BTC LTH SOPR has spiked up recently while the price has gone down, suggesting that some older, more profitable coins have just been moved by this cohort.
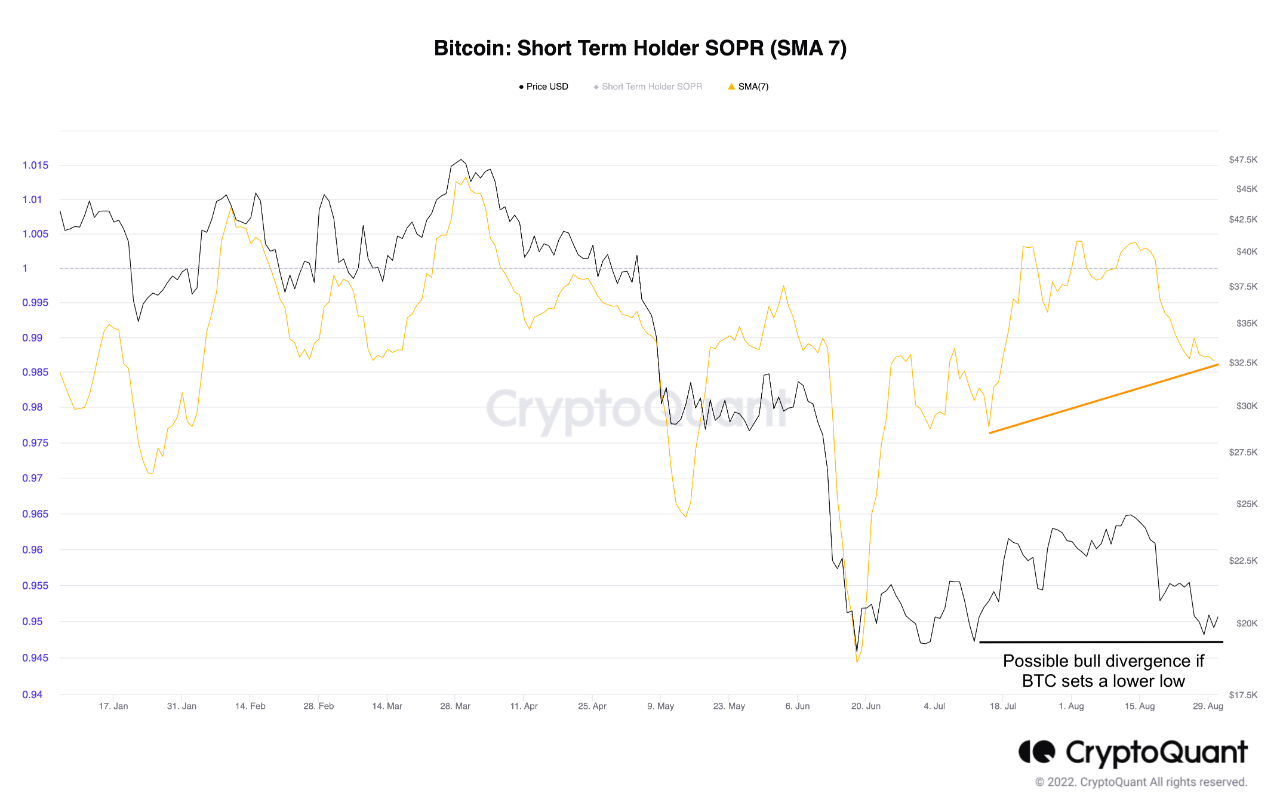
STH SOPR has, however, plunged down in the last few days. The below chart displays this trend.

Looks like the value of the metric has seen some decline recently | Source: CryptoQuant
The contrast between the two SOPRs could mean there is more selling pressure coming from the LTHs as compared to the STHs.
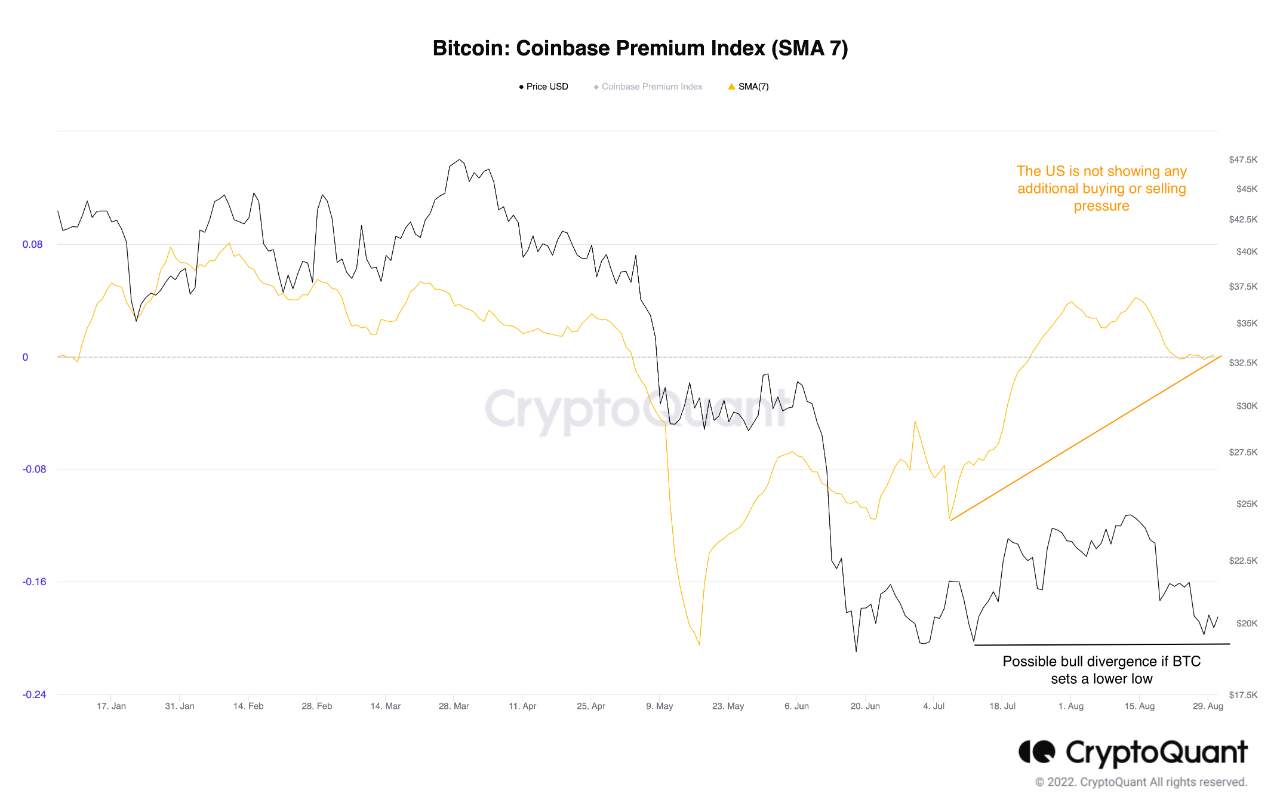
Lastly, the quant also talks about the Bitcoin Coinbase Premium in the post. This indicator measures the difference between the price listed on Coinbase and that on Binance.
Since Coinbase is used more heavily by US investors, while Binance sees a more global audience, the Premium can tell us whether US investors are selling or buying more compared to the rest of the world.

The metric has approached a neutral value in the last week or so | Source: CryptoQuant
As the graph shows, the Bitcoin Coinbase Premium has been around zero lately, indicating there isn’t any extraordinary selling (or buying) pressure coming from American investors right now.
BTC Price
At the time of writing, Bitcoin’s price floats around $19.7k, down 8% in the past week.

BTC continues sideways movement | Source: BTCUSD on TradingView
Featured image from André François McKenzie on Unsplash.com, charts from TradingView.com, CryptoQuant.com


