Published 10 mins ago
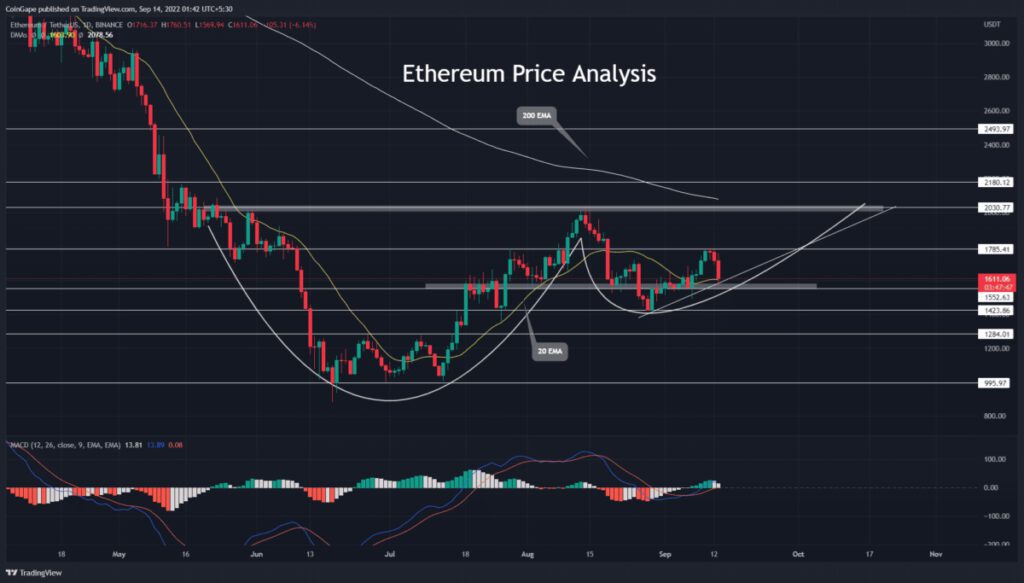
The daily ETH/USDT technical chart shows the formation of a cup and handle pattern. In response to this pattern, the coin price should follow an uptrend direction and break the neckline resistance of $2000. By doing so, the Ethereum price would obtain an early signal for trend reversal which could grab the first target of $2500. However, the coin price currently trades at $1575 and 8% down on the intraday level.
advertisement
Key points from Ethereum price analysis:
- The Ethereum price has lost 11% in the last three days.
- An upcoming support trendline may assist buying to maintain a recovery rally.
- The intraday trading volume in Ethereum is $22.5 Billion, indicating an insignificant rise of 22.8%.

Source- Tradingview
Today’s sell-off initiated with the fresh data consumer price index(CPI), pointing to an 8.3% YoY inflation. However, the bearish momentum accelerated as the CME Fed Watch Tool showed a 20% chance of a 100 bps or 1% interest rate hike. Thus, the market sentiment is again in turmoil, and questioning has the bottom really formed.
Anyhow, the technical chart currently shows a bullish reversal pattern governing the Ethereum price action, and therefore, traders can keep a bullish outlook until they don’t lose the swing low support of $1430.
Trending Stories
As of now, the bearish engulfing candle retests the combined support of $1550 and the upcoming support trendline. However, if today’s daily candle closes above this support, the price holds a recovery opportunity.
A possible reversal from this concentrated support will surge the altcoin 28% higher to hit the neckline of the aforementioned pattern.
On a contrary note, if the selling pressure persists and the daily candle closes below $1550, the price will fall to $1430 and attempt to breach it
Technical indicator-
MACD indicator: the fast and slow lines wavering exactly over the mid-zone indicates a neutral sentiment among the market participants.
advertisement
EMAs: it seems the EMAs have marked the crucial level of technical chart offering weightage to those levels. Thus, the 20-day EMA at $1550 support assists buying to sustain the bullish pattern. Moreover, the 200-day EMA at $2000 resistance creates an additional barrier against bulls.
- Resistance level- $1785 and $2000
- Support level- $1550 and $1430
Share this article on:
The presented content may include the personal opinion of the author and is subject to market condition. Do your market research before investing in cryptocurrencies. The author or the publication does not hold any responsibility for your personal financial loss.


