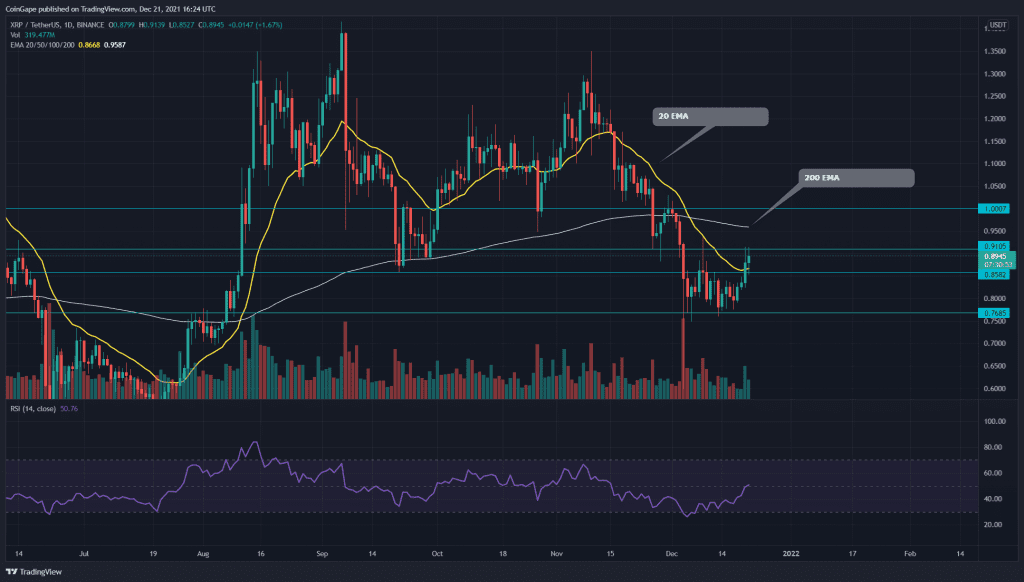
The XRP/USD chart currently follows a short-term downtrend in this coin. Last week the price plunged to the $0.76 mark, indicating a 43% loss from its previous high of $1.3. However, the chart shows a cup and handle pattern, which could initiate a bullish reversal for the Ripple coin.
Key technical points:
- The XRP coin price crosses above the 20-day EMA
- The daily RSI shows impressive recovery concerning the price action
- The 24-hour trading volume in Ripple coin is $3.59 Billion, indicating a 5.96% loss.
Source-Tradingview
Previously we mentioned in our article on Ripple coin, and the pair tried to bounce back from the $0.88 support. However, the price couldn’t sustain above the $1 mark, resulting in a bearish reversal.
Furthermore, with the sudden sell-off on December 4th, the coin price even breached the crucial support of $0.86 and plunged to $0.7614. This pair was hovering above this level for two weeks, identifying sufficient support. The current price of this coin is $0.9, with an intraday gain of 3.35%.
The XRP price maintains a bearish trend according to the EMA levels (50, 100, and 200). However, this recent bullish pullback has already reclaimed the 20 EMA line.
The daily Relative Strength Index (51) shows an impressive recovery in value, indicating the buyers are retaking charge.
XRP/USD 4-hour time frame chart

Source- Tradingview
The XRP/USD chart forms a cup and handles pattern in the 4-hour chart. The pattern’s neckline is at the $0.91 mark, and the coin price is currently standing at the doorstep of this resistance.
The crypto traders can consider positioning their funds in this pair once the price breaches the overhead resistance. Moreover, the 4-hour 200 EMA coincides with the neckline, providing an extra edge for a bullish breakout.
The MACD indicator shows that the fast line(blue) and slow line(orange) move towards the strong bullish zone.


