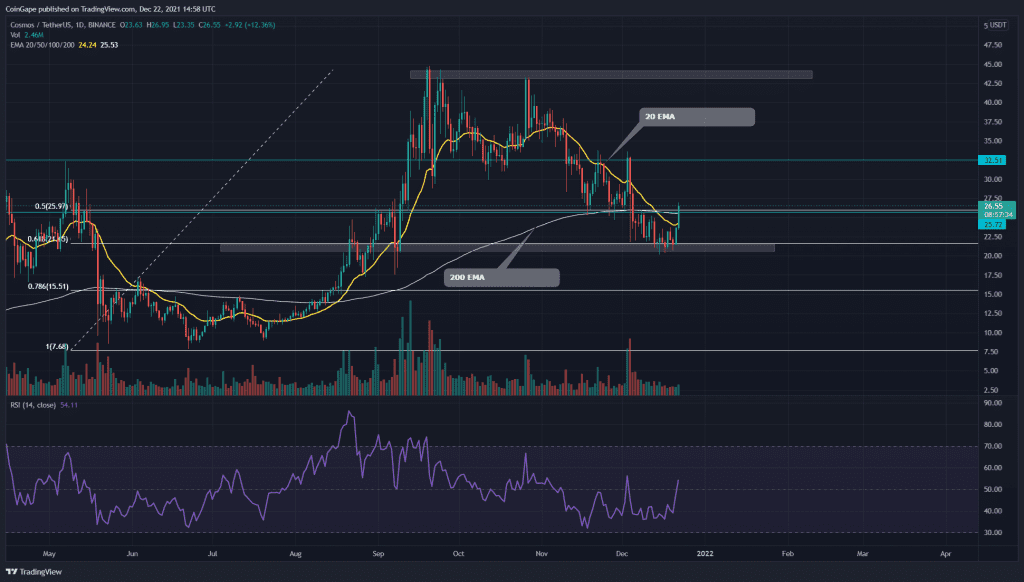
The Cosmos coin price action showed a steady correction phase in this chart. The coin price lost half its value and plugged into the $20 support. After experiencing strong support from this bottom level, the price attempts for a recovery phase, starting from the crucial resistance levels near the $25 mark.
Cosmos/ATOM/USD Daily Time Frame Chart
Source- Tradingview
Past Performance or Trend
On October 26th, the Cosmos coin failed to breach the All-Time High resistance of $44.5 and entered into a correction phase. This moderate pullback plummeted the coin price to the 0.618 Fibonacci retracement level, indicating a nearly 50% discount in its value.
The RSI Chart Shows A Significant Recovery In Its Chart
For more than three weeks, the ATOM coin price has been wobbling between $26 and $20 level. This pair obtained sufficient demand pressure from the bottom support during this consolidation period, preparing for a bullish reversal.
Today, the coin shows a long bullish candle of $13% gain, breached a confluence of crucial resistance levels, indicating an excellent long opportunity for crypto trades.
These resistance levels are;
- A horizontal level of $26.2
- 0.5 FIB level
- 200 EMA of both daily and 4-hour chart
Therefore, reclaiming this resistance level is essential for the coin buyers to initiate a new rally.
By the press time, the ATOM coin is trading at 26.7, with an intraday gain of 13%. The 24hr volume change is $511.9 Million, indicating a 72% hike. According to the coinmarketcap, the coin stands at 30th rank with its current market cap of $6 Billion(+15.7).
Technical Indicators-
- -The daily Relative Strength Index (53) has recently crossed above the neutral line, supporting the ongoing rally.
- -As mentioned above, the ATOM coin is trying to cross above the 200 EMA line as well, providing an excellent edge for the long traders.
- -The MACD indicator shows both its lines are steadily moving higher in the bullish zone, with the histogram chart confirming the progress with consecutive longer green candles.


