The cryptocurrency market has remained stable over the last couple of days. The market movers such as Bitcoin and Ethereum have also risen in their charts. But they have also been subjected to resistance at their critical price ceilings.
Many altcoins have followed the same path, and some have witnessed tremendous growth in the last few days.
Fantom/FTM/USD Four Hour Chart
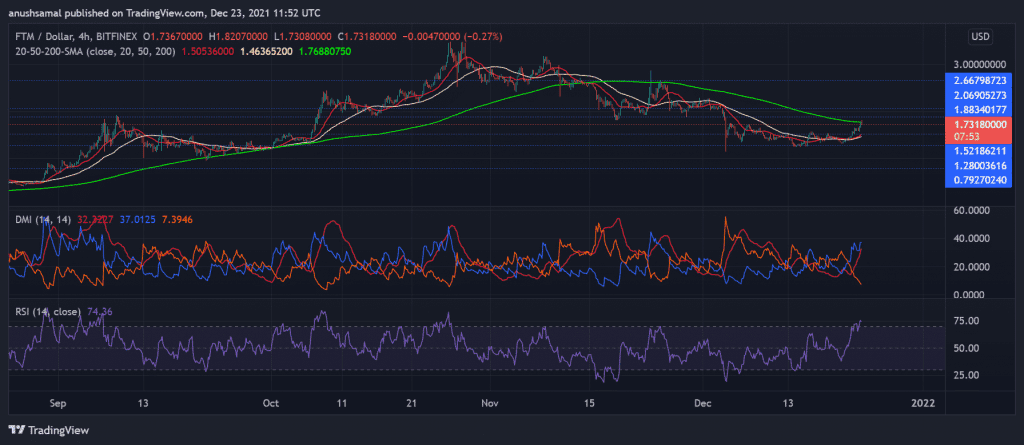
Fantom propelled significantly in the past week so that FTM stood above the 200-SMA line, indicating extreme bullishness. At press time, the coin was trading for $1.73 after registering more than a 10% gain in market value in the last 24 hours.
As Fantom continued its northbound journey, the coin has now made $1.28 its robust support level. The technicals of the coin continued to signal at a growing bullish price momentum. With a continued recovery in the market, the coin can again note substantial price upliftment at the end of this year.
The price of Fantom was above the 20-50-200 SMA lines, a reading that signifies an extreme bullish force in the market. The Relative Strength Index was placed above the 75-mark, signaling an overbought asset.
Directional Movement Index sided with the bulls, which meant that the market buyers drove prices. With continuous upward movement, FTM might close at the $2 mark by the end of the month.
ATOM/USD Four Hour Chart
COSMOS was priced at $27.15 after it rocketed by 10.2% in the last 24 hours. The digital currency’s prices stood above the 200-SMA line, indicating a strong bullish influence. The immediate support level was at $25.64, going beneath which the coin might halt at $22.25.
Although it soared considerably, COSMOS had experienced a strong resistance at $30.76. A consistent push from the bulls could cause ATOM to topple over the $30.76 mark.
The price of COSMOS was above the 20-50-200 SMA line, which again meant that the coin was on a bullish run. The Relative Strength Index was overvalued as the indicator was above the 75-mark, despite noting a downfall. The continued surplus of buyers might help ATOM get past its immediate resistance. On Balance Volume also suggested that buying strength was high in the market.


