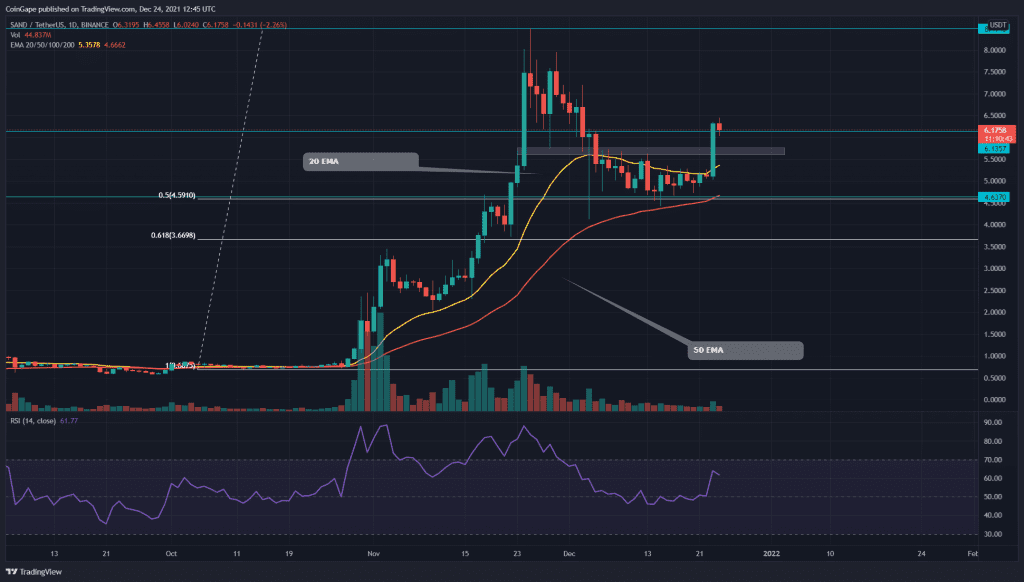
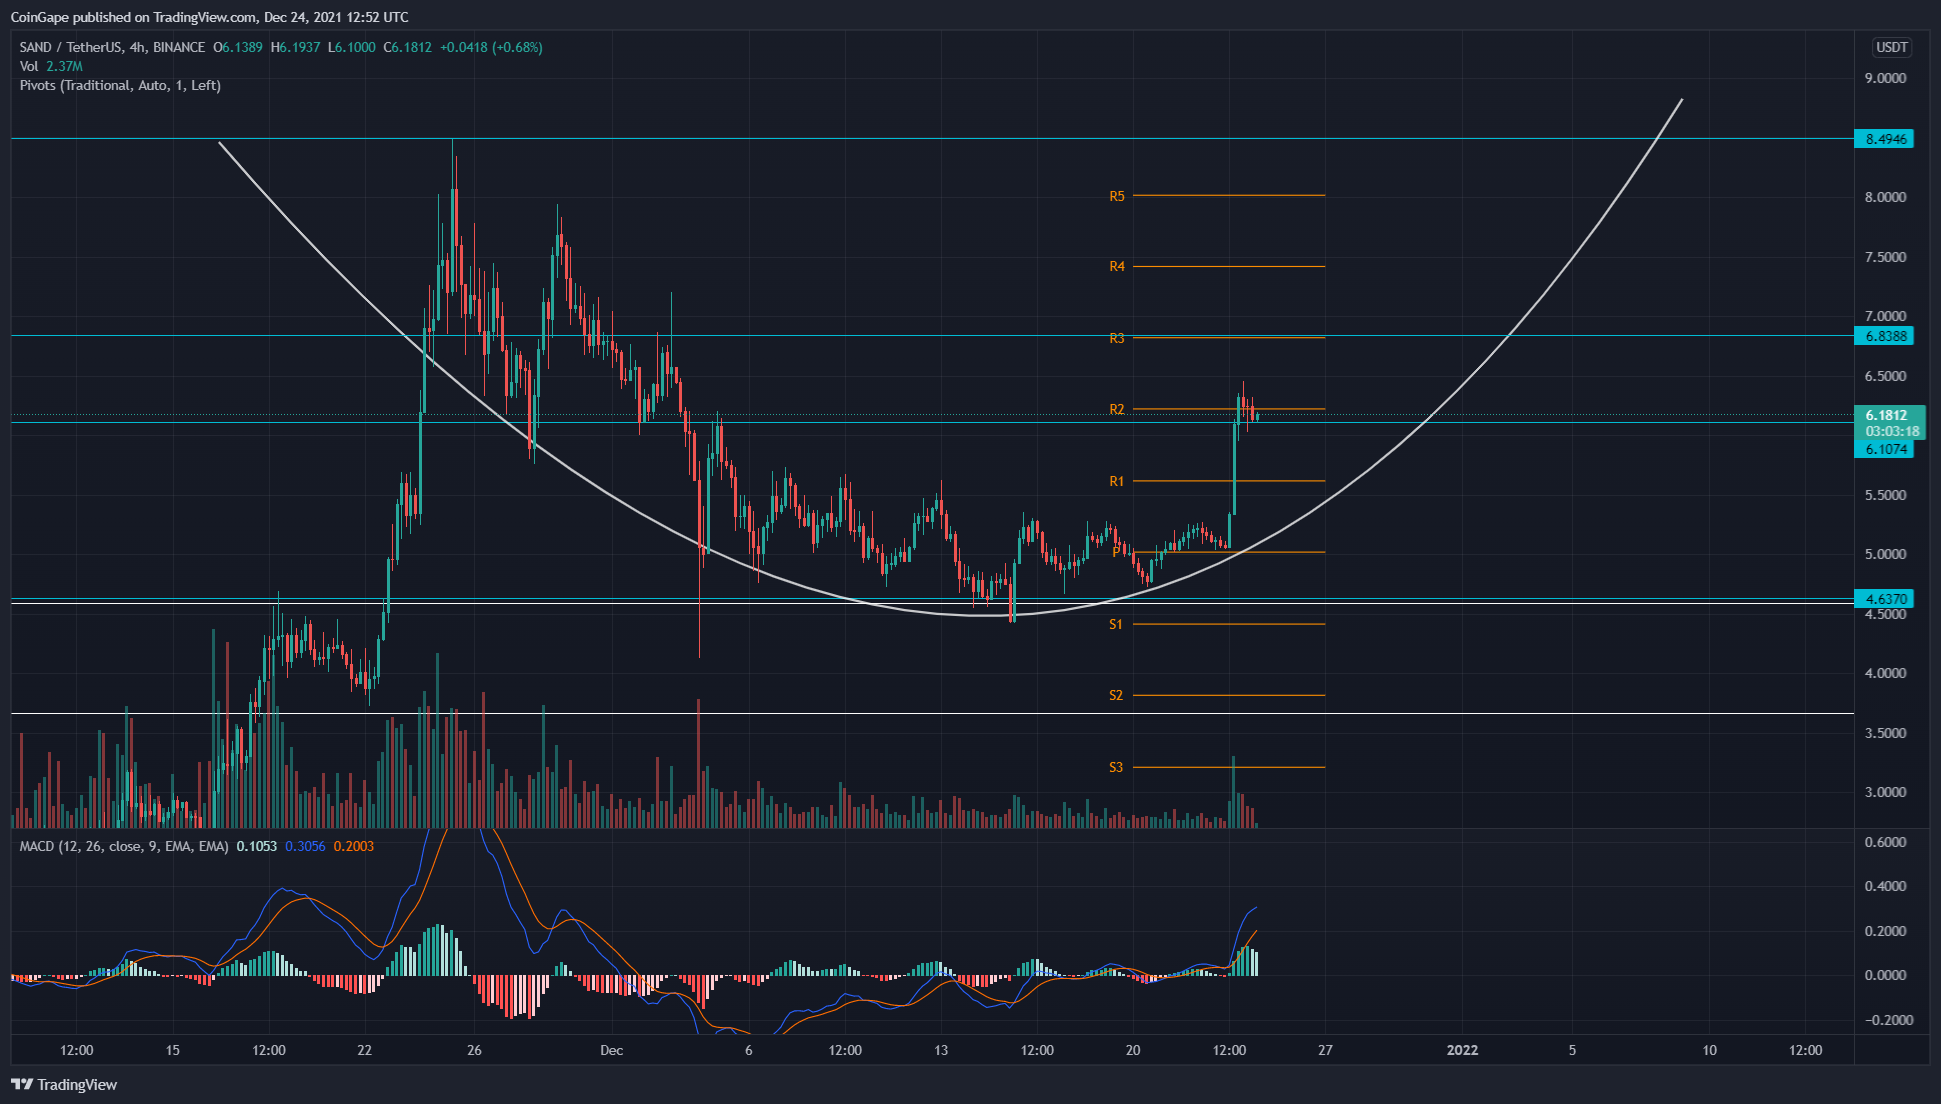
The correction phase in the SAND token plummeted the price to the 0.5 Fibonacci retracement level. This pair spent more than three weeks acquiring sufficient support from the bottom level, which eventually initiated this new rally. Moreover, the chart also shows a rounding bottom pattern which can lead the price to $8.5 or even beyond it.
Key technical points:
- The SAND price reclaims the 20-day EMA
- The 24-hour trading volume in the sandbox token is $2.82 Billion, indicating a 335.1% gain.
Source-Tradingview
The last time when we covered an article on Sandbox token, its price resonated in a narrow range, extending from $4.6 support to $5.6 resistance zone. During this consolidation, the token price gained enough support to bounce back from the bottom support level.
On December 23rd, the token price provided a huge bullish engulfing candle of 22% gain, which breached the $5.6 and $6.1 resistance in one shot, offering a great opportunity for a long trade.
This new rally has flipped the 20 EMA dynamic resistance into possible support. Moreover, the daily chart has reclaimed its bullish alignment of the crucial EMAs(20, 50, 100, and 200).
The Relative strength index(61) projected significant recovery in its chart and has crossed above the neutral line(50).
Sandbox/USD 4-hour time frame chart
Source- Tradingview
The SAND token chart revealed a rounding bottom pattern in the 4-hour time frame chart from this whole structure of retracement and recovery. The neckline for this pattern is also the All-Time High level, i.e., 48.5, and following the pattern, the price should soon rally to this milestone.
However, as mentioned, the price broke out from the $6.1 mark and is currently going through a retest phase. The crypto traders can expect a retracement to the $6.1 or $5.75 mark, which would confirm the demand pressure for continuing its rally.
The traditional pivot levels indicate the traders will expect to meet their next resistance level at $6.8 and $704. For the opposite end, the support levels are $5.6 and $5.


