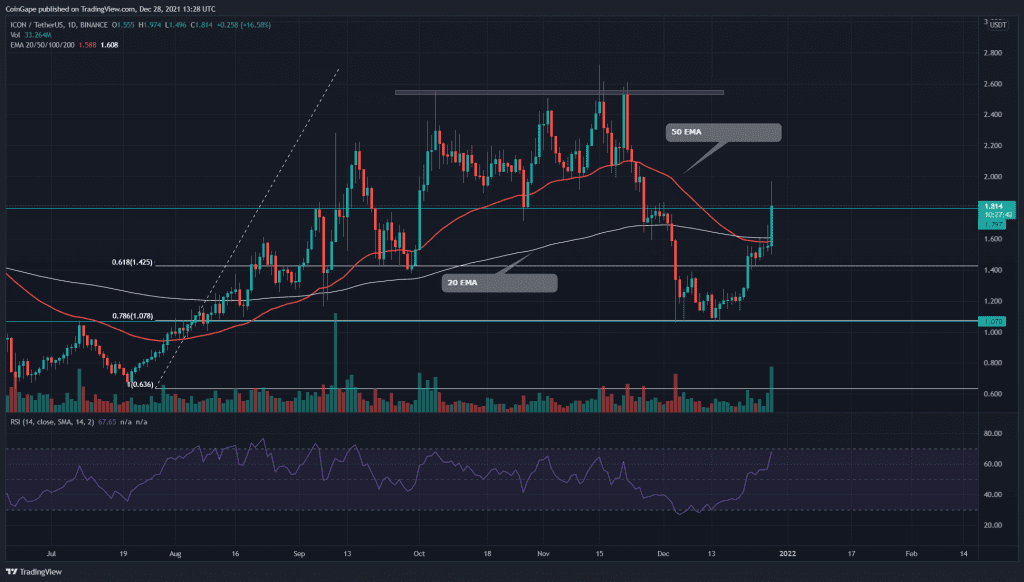
The ICX coin started displaying positive signs from the $1 support from mid-December. The increasing underline bullishness of the price initiated a new rally which is currently 65% from the bottom. Today, the token showed a sudden boost in its price, which could be triggered by the 1:1 Airdrop of both ICY and ICZ tokens for ICX and sICX holders.
ICON/ICX Coin In The Daily Time Frame Chart
Source-Tradingview
Past Performance in ICX coin Chart
The ICON coin price carried a steady rally from late July, making a high point at $2.7. However, this peak was a third touch to the resistance zone near $2.5, and after the last retest, the coin entered a correction phase. The pair lost 58% from this previous high and plummeted to the 0.786 Fibonacci retracement level.
ICON Coin Price Breaks Out From A Rounding Bottom Pattern
The ICX coin stayed near $1 support for nearly two weeks, trying to identify sufficient demand pressure. The coin chart started showing lower price rejection candles to begin a recovery rally at this support.
This new rally eventually showed a rounding bottom pattern in the 4-hour time frame chart. Today, the price finally provided a decisive breakout from the $1.8 neckline, indicating more potential for this rally.
The pair is currently in a retest phase and trying to hold above the new support. The crypto traders can consider entering a long position if the price shows enough sustainability above this level or $1.65.
By the time of writing this article, the ICON coin is trading at $1.82, with an intraday gain of 17%. The 24hr volume change is $593.8 Million, indicating a 818.42% hike. As per the Coinmarketcap, the coin stands at 83rd rank with its current market cap of $1.26 Billion(+10.36).
ICX Coin In The 4-hour Time Frame Chart

Source-Tradingview
Technical Indicators-
-The daily Relative Strength Index(53) of the 12-hour time chart frame shows a steady upward rally, approaching the overbought territory.
-Today, the ICX price crossed above the 50 and 200 EMA line with its huge bullish candle, reclaiming its bullish alignment.
-the important chart level for this coin are;
Resistance; $2, $2.2
Support; $1.8, $1.68-1.66


