Today, the crypto market displayed mixed trading signs, with some coins flashing consolidation while others have either appreciated or depreciated in the last 24 hours.
The market capitalization stood at $2.45 Trillion with a 2.5% adverse change in the last 24 hours.
At press time, Aave was priced at $278.88 while PancakeSwap struggled to break its immediate resistance price level. The technicals of these two coins portrayed mixed signals with more inclination towards a positive price action.
Aave/USD Four Hour Chart
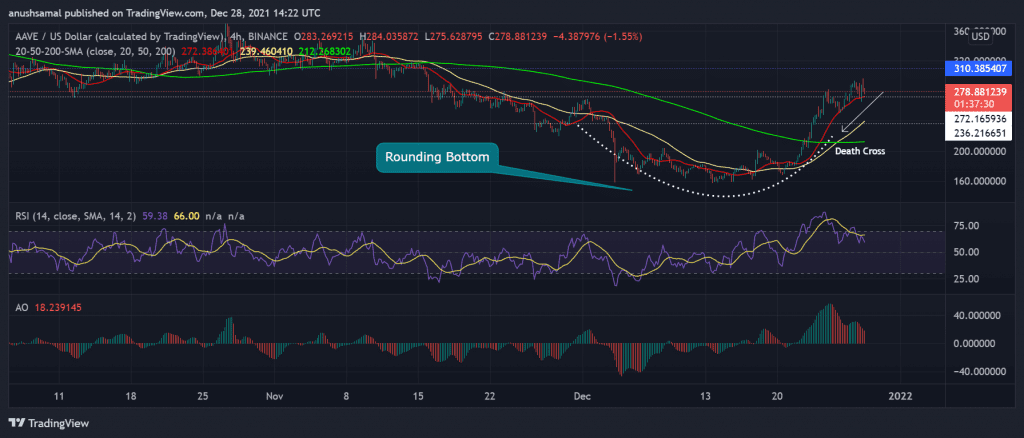
Aave’s price saw an uptrend in the last few days, right after the altcoin had formed a rounding bottom on its chart. In accordance with what follows, the prices of Aave noted appreciation as the coin toppled over many resistance lines one after the other.
Over the last 24 hours, the coin’s price action was quite mundane as it was mainly consolidating above the $272.16 level. Overhead resistance for the coin stood at $310.38. Aave displayed a death cross, which signifies a trend reversal. The chances of a downward price action remain.
The price of Aave was above the 20-SMA line, which signified that buying pressure still dominated the market. As a price reversal could occur, the immediate price where Aave could find support rested at $272.16 and then $236.21.
The Relative Strength Index was slightly below the 75 mark signaling heavy buying pressure in the market. Awesome Oscillator displayed red histograms, although they were decreasing in magnitude.
CAKE/USD Four Hour Chart

PancakeSwap has been experiencing a mundane price action over the past few days and was trading for $12.56 at writing. Immediate overhead resistance stood at $12.93, moving above which the coin could trade near the $14.59 price level.
Near-term technicals for the coin pointed towards a bullish price action in the market, with main technical indicators displaying buying pressure.
The Relative Strength Index was above the half-line as CAKE was still positive despite trading laterally in the past few days. A fall beneath this level will cause CAKE to trade near the $10.80 price mark. Awesome Oscillator displayed red histograms. However, the histograms were declining in size marking a slow down of bearishness.
The Directional Movement Index was positive despite sideways trading, and the +DI line was still seen above the -DI line as selling pressure hadn’t taken over as of yet.


