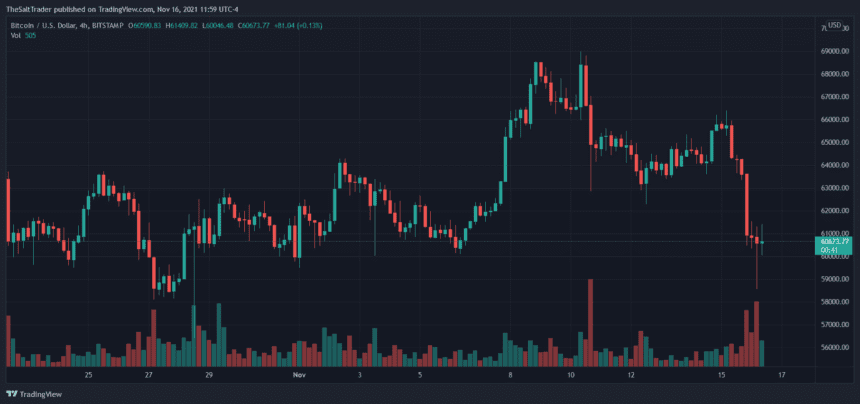
Blood has been shed as Bitcoin dropped below $60,000 once again and hints at more downside. The first crypto by market cap trades at $60,800, as of press time, with a 5% loss in the daily chart.
Although it has seemed some recovery, Bitcoin registers a correction of around 12% from its all-time high as an increase in selling pressure caused the entire crypto market to take a dive.
Related Reading | Bitcoin Bears Are Back, Why BTC Could Even Dive Below $60K
The general sentiment in the market has flipped from extreme greed to normal greed levels, according to data from Arcane Research. Despite the correction, traders and operators remain optimistic about potential new highs.
This metric could continue to fall as Bitcoin moves at the low of a range between $58,000 to around $70,000 and the market reset. The derivatives sector is likely to be the most affected.
As NewsBTC reported, Bitcoin futures contracts across the board got overheated as BTC’s price pushed into uncharted territory. This created a lot of liquidity at the lows and a rise in funding rates.
In other words, a lot of traders took over-leveraged long positions expecting more upside, but large investors drove the price below $59,000 to take advantage of the liquidity and fill their orders.
Post-crash, funding rates have returned to neutral territory in almost every crypto exchange platform. Along with the market sentiment provided by Arcane Research, and the fact that the price of Bitcoin held at $58,6000, this suggests a potential bottom has formed, at least for the short term.
Data provided by CryptoQuant records over $33 million long liquidations in one hour as BTC’s price went below its current levels. The Open Interest (OI) decreased by 2.33% in the past day or about $350 million.

Additional data provided by Glassnode indicates that the OI for Bitcoin Futures contracts has reached a 5-month low of $711,951,837 on crypto exchange Bitmex. As seen below, a dropped in OI during September and October was preceded by more BTC appreciation.
📉 #Bitcoin $BTC Futures Open Interest just reached a 5-month low of $711,951,837.33 on #Bitmex
Previous 5-month low of $713,112,500 was observed on 24 September 2021
View metric:https://t.co/GyObF5WOjC pic.twitter.com/bsa9S166ZP
— glassnode alerts (@glassnodealerts) November 16, 2021
Bloodbath Over, Bitcoin Ready To Moon?
However, Bitcoin whales could try to push the price down one more time to leverage the liquidity concentrated around $57,700, according to data from monitor Whalemap.
In addition, the apparent indirect correlation between BTC’s price and the U.S. Dollar (DXY Index) could create more hurdles for the bulls. The dollar recently broke above a major resistance zone and stands at a 16-month high.
This rally could have been triggered by macro-economic factors, including the start of tapering by the U.S. FED and the increased risk in the Asian markets due to the Evergrande crisis.
Related Reading | Bulls Giving Up? Massive Bitcoin Bid Wall Removed, What It Could Mean For BTC
The above adds to an already uncertain market. One thing seems true, BTC’s price must hold at $58,000 if it wants to return to price discovery in Q4, 2021.


