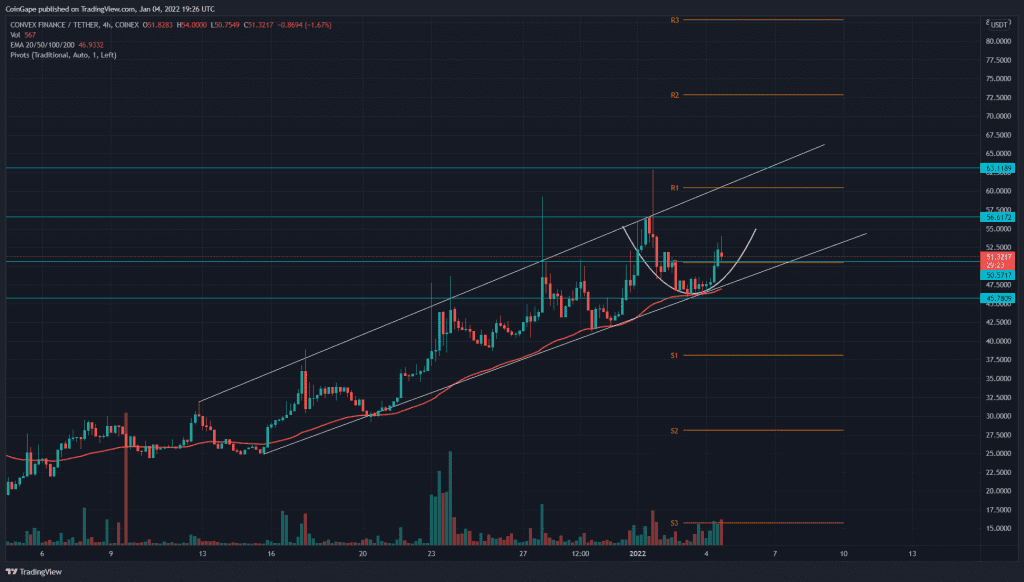
The Convex Finance (CVX) token grows more than 50% with the breakout of the consolidation range in the daily chart. Moreover, the price action forms a bullish continuation pattern, i.e., a rising channel pattern in the 4-hour chart. Currently, a rounding bottom within this channel prepares a bullish breakout, indicating another breakout entry opportunity awaits.
Key technical points:
- The CVX token price sustains a rising channel in the 4-hour timeframe
- The 24-hour trading volume in the Convex Finance (CVX) token is $51.80 Million, indicating a 5% fall.
Source-Tradingview
Previously when we covered an article on the Convex Finance token, its price gave a retest of the consolidation range breakout in the daily chart. The rally forecasted after the retest has resulted in a 50% gain and a bullish continuation pattern in a shorter time frame.
The post-breakout uptrend leads to a rising channel pattern in the 4-hour chart, with price recovering from the recent dip to the support trendline. Moreover, the price action within the channel forms a rounding bottom pattern with the neckline at the $56 mark.
The fewer number of dips to support the trendline in comparison to the bullish attempts to break above the channel indicates massive growth in buying pressure. Therefore, the breakout above the $56 mark can result in a price jump to the $73 mark.
The daily Relative Strength Index (67) struggles to rise into the overbought zone as it shows zig-zag move near the overbought boundary. Additionally, the price finds constant support from the 50-period EMA in the 4-hour chart that has pushed every bearish attack in the rising channel.
CVX token Sustains Bullish Momentum Above Consolidation Breakout

Source- Tradingview
The breakout of the consolidation range between the $39 and $18.5 mark initiated a new uptrend in this CRV token. The coin price gradually rises with multiple three rising method patterns in the daily chart. The traditional pivot levels suggest the price can expect the next supply zones near the $73(R2) and 82(R3) mark.
The technical chart indicates the important chart levels are:
- Resistance- $56.4 and $62.8
- Support levels- $50.6 and $4


