BeInCrypto takes a look at on-chain indicators for Bitcoin (BTC), more specifically the MVRV Z-Score, and then the Market and Realized capitalization levels, which create MVRV.
MVRV Z-Score
MVRV is an on-chain indicator created by dividing the Market Value with the Realized Value, hence the name MVRV. Simply put, a reading of five shows that the market cap is five times as big as the realized cap. It is used to determine a “fair” price of BTC, since when the market value is considerably higher than the realized value, it often means that BTC is overpriced.
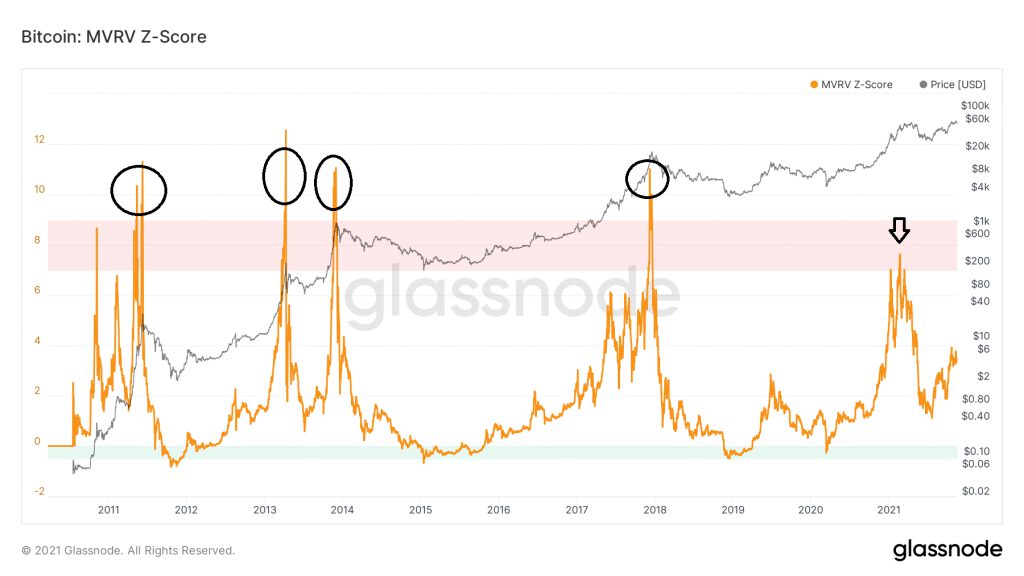
The MVRV Z-score simply adds a standard deviation to the calculation. Values between 7 and 9 (highlighted in red) are considered overbought. All four market cycle tops so far have had values above this area (black circles).
However, the 2021 BTC high has a value of 7.63 (black arrow). Therefore, at the time, the market was considerably less overbought than it was during the previous market cycle tops.
More interestingly, despite the BTC price reaching yet another all-time high on Nov 10, MVRV Z-score is still at 3.33.
This means that the realized value is keeping pace with the market value of BTC.
Realized and market capitalization
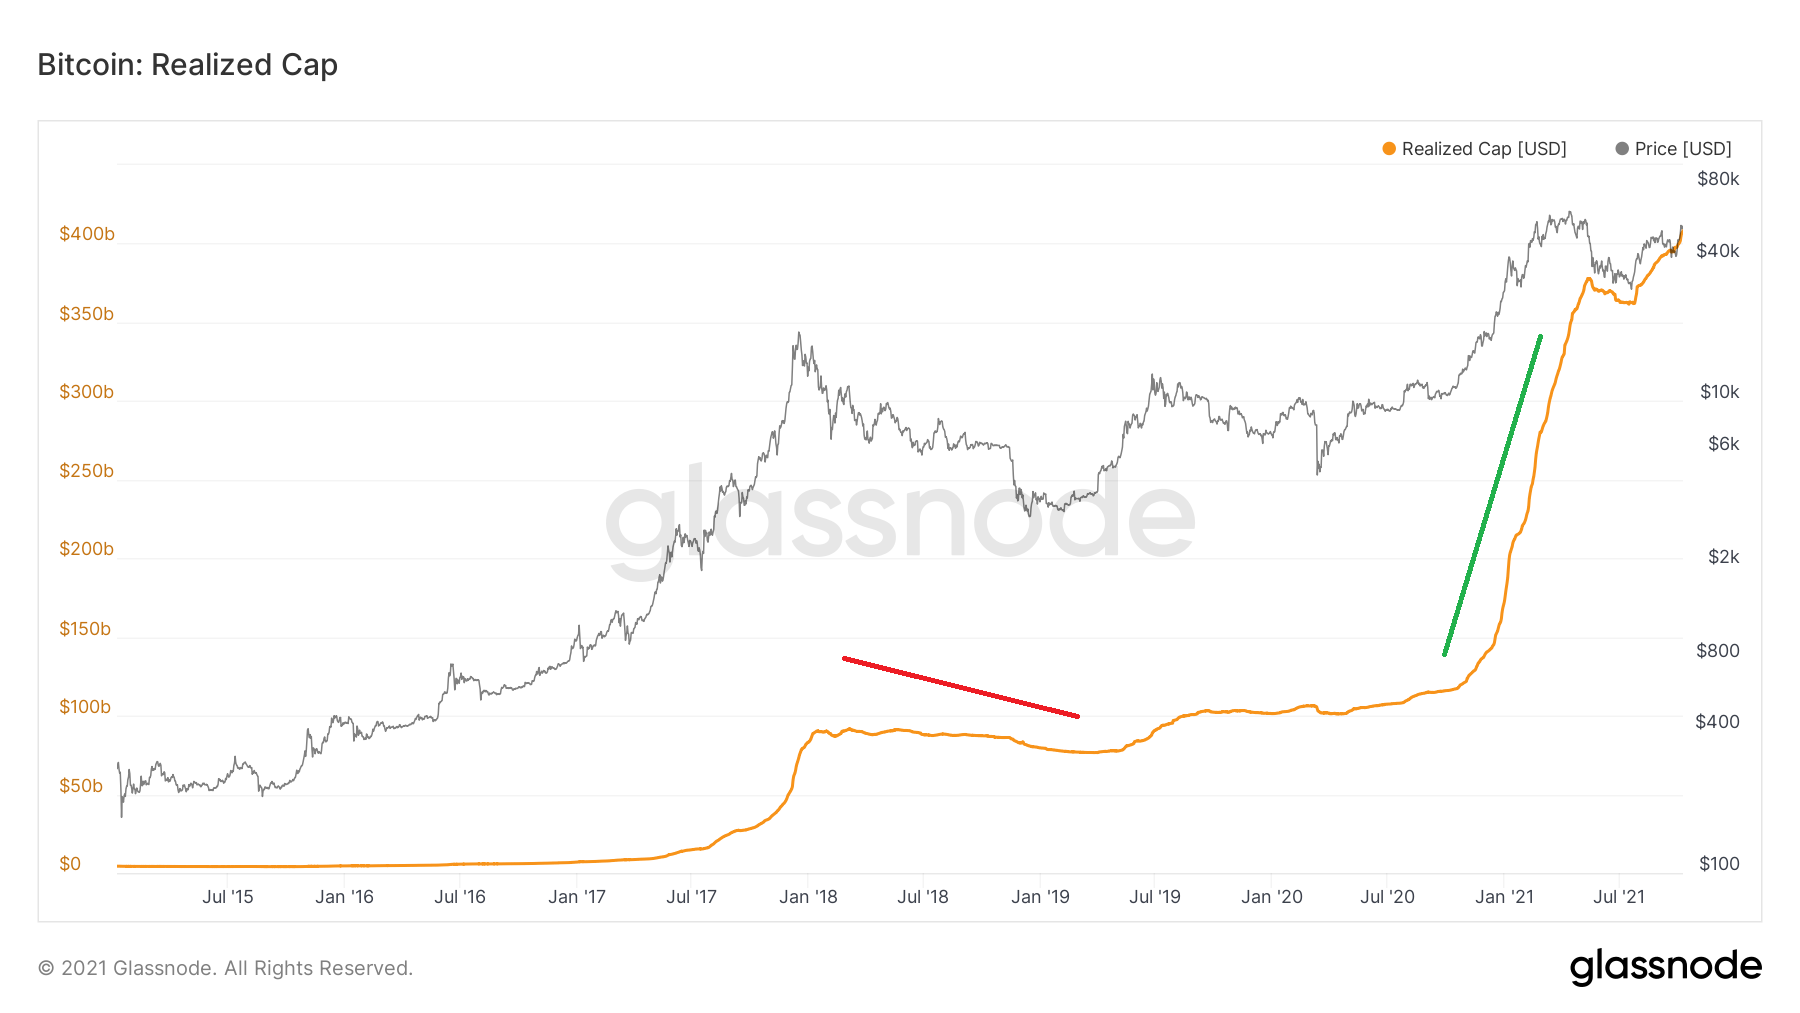
The market cap (MC), is created by multiplying the number of coins that are mined with the current price. The realized cap (RC) uses the price at the time they last moved. Therefore, it can be seen as a more accurate representation of the current value of BTC, since it devalues coins that have not moved for a significant period of time.
RC usually increases in bull markets, since old coins are spent in order to realize profit. It decreases during bear markets, when investors sell at a loss.
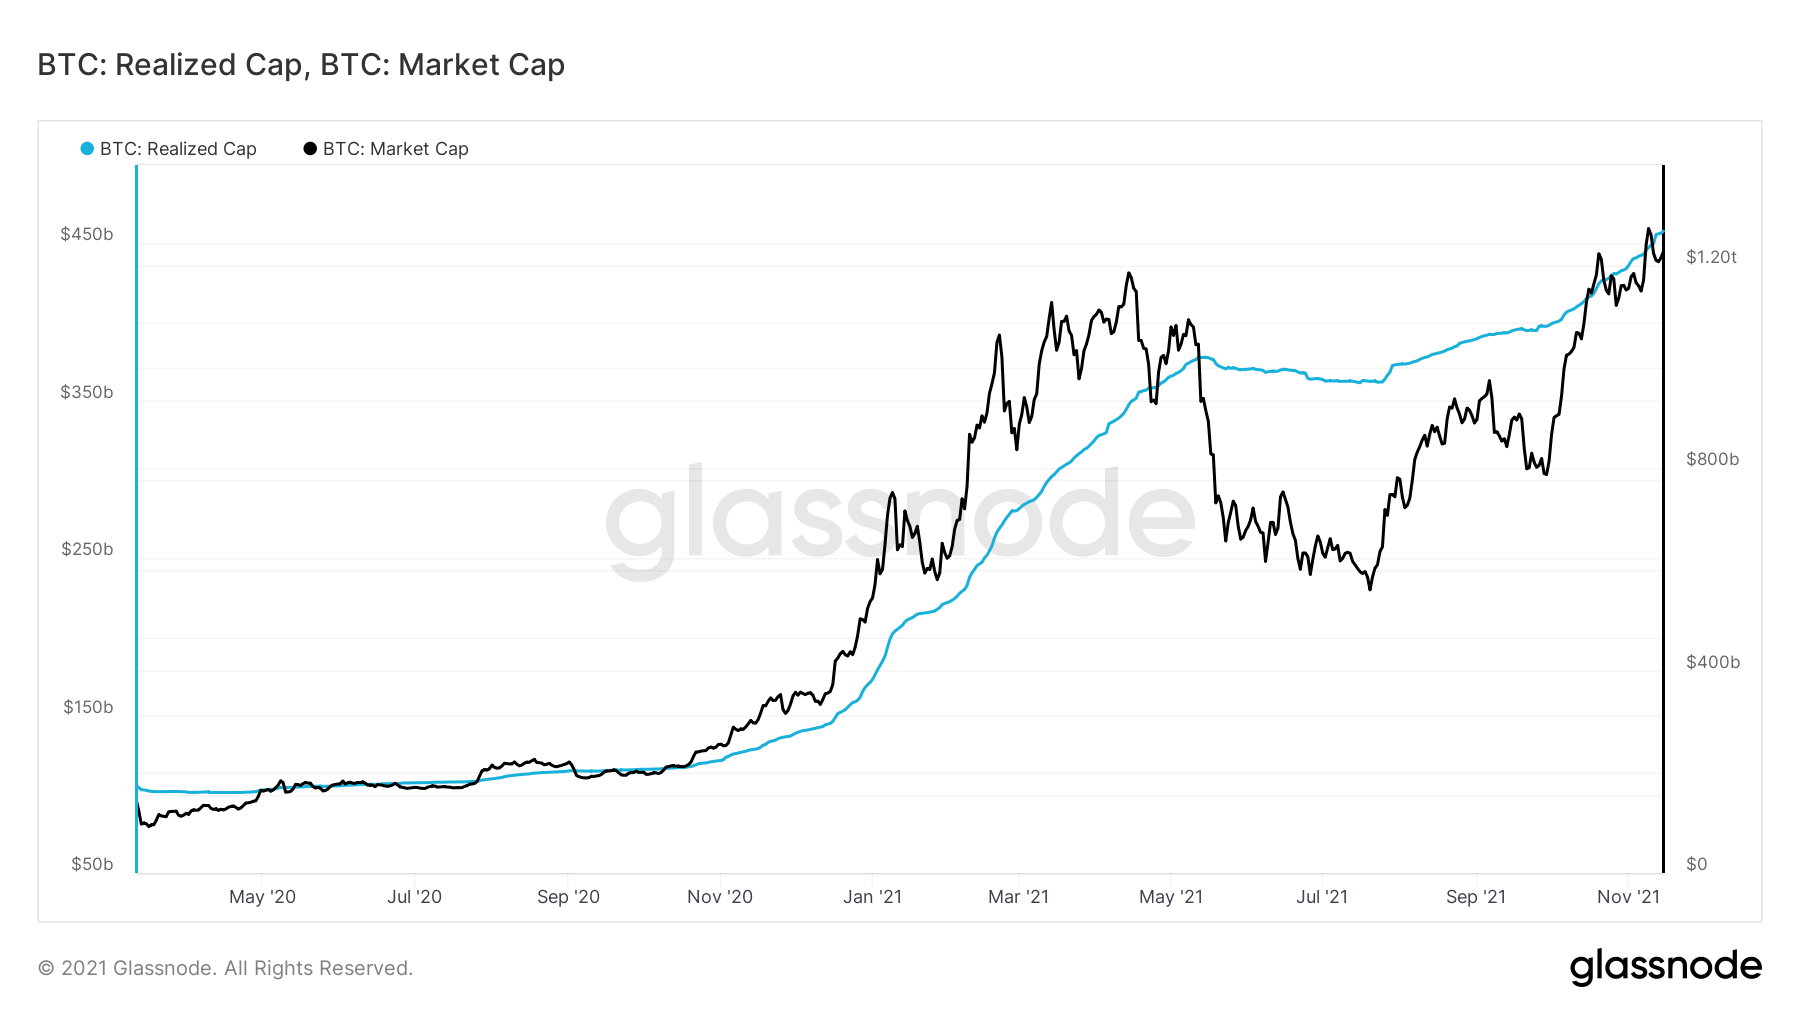
RC has been increasing at a rapid pace since the beginning of March. After a brief pause during May – July, when the BTC price was correcting, RC resumed its upward movement.
As outlined above, this is a sign of bull markets.

When compared side by side to the market cap (blue), it is visible that the Realized cap (blue) increase is smoother. Since the BTC upward movement began in July, the realized cap has not dipped at all, even though the market cap has done so in the short-term.
Therefore, investors are not selling at a loss during these short-term dips, rather are taking profits on the way up, as is a characteristic of bull markets.

For BeInCrypto’s latest Bitcoin (BTC) analysis, click here.
Disclaimer
All the information contained on our website is published in good faith and for general information purposes only. Any action the reader takes upon the information found on our website is strictly at their own risk.


