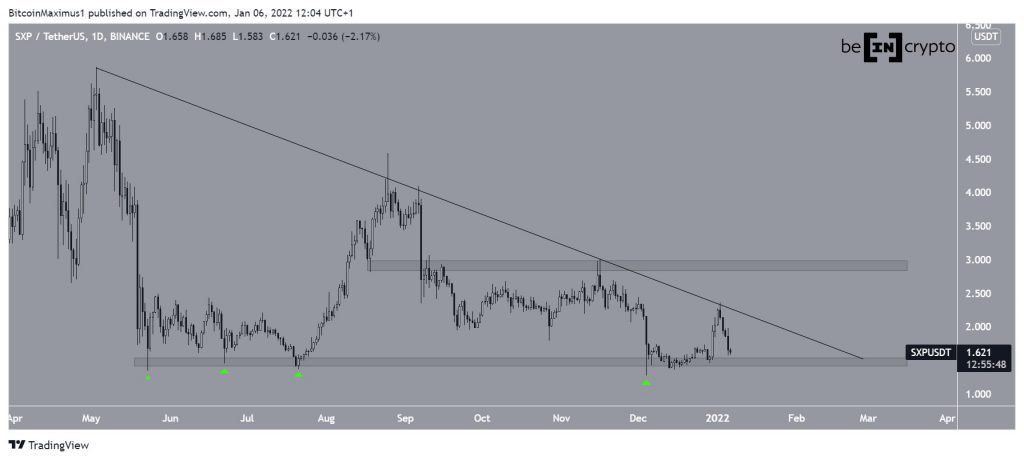
Swipe (SXP) is at risk of breaking down from the $1.50 horizontal support area, since each successive bounce has been weaker than the previous one.
SXP has been decreasing alongside a descending resistance line since reaching an all-time high price on May 3. Throughout this period, it bounced above the $1.50 horizontal support are four times (green icons). Most recently, it did this on Dec 4, creating a very long lower wick in the process. This is considered a sign of buying pressure.
On Jan 2, SXP reached a high of $2.35, which was 85% above the aforementioned lows.
However, the token failed to break out from the descending resistance line and is approaching the $1.50 horizontal support area once more. The fact that each bounce has been weaker than the preceding one is a bearish sign, and could suggest that a breakdown will soon transpire.
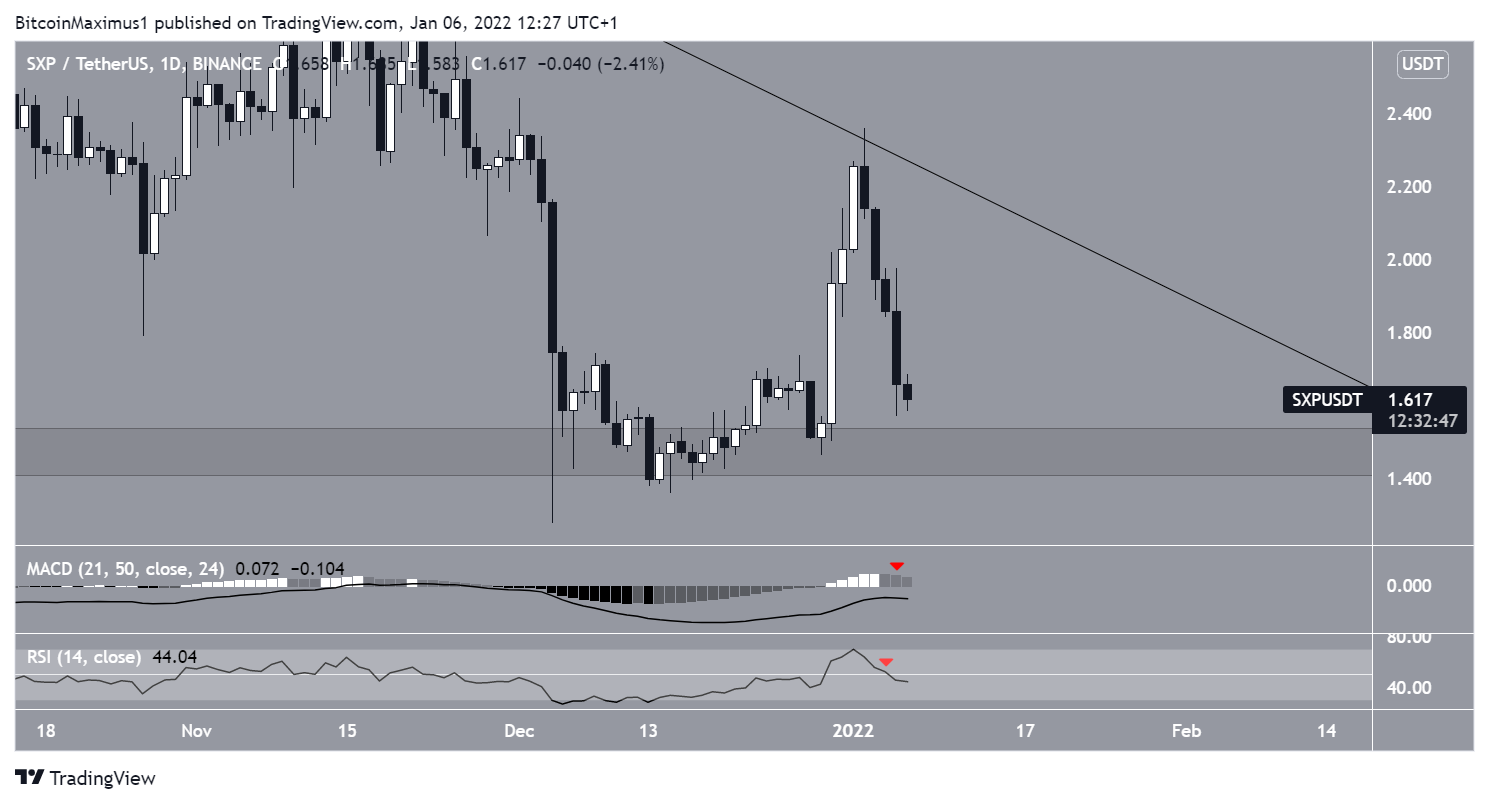
Indicator readings
Technical indicators are showing bearish signs.
The MACD, which is created by a short- and a long-term moving average (MA), is decreasing, and it is in negative territory. While it had previously begun an upward movement, the trend has turned bearish over the past three days. This means that the short-term MA is slower than the long-term one and is a bearish sign.
The RSI, which is a momentum indicator, has fallen below 50 (red icon). This is also a bearish sign and supports the possibility of a breakdown.
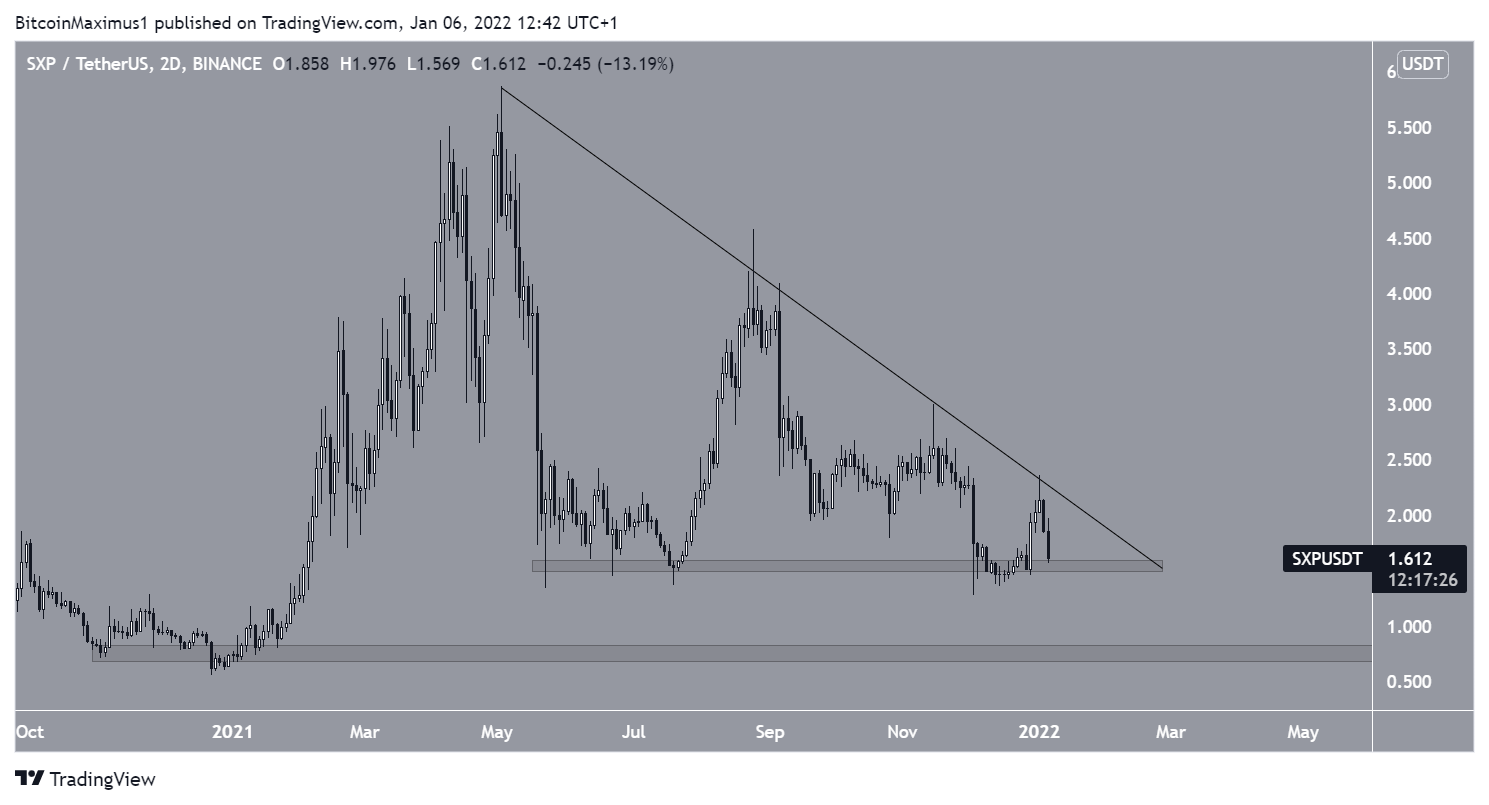
If a breakdown occurs, the closest support area would be at $0.75, close to the Jan 2021 lows.
SXP wave count
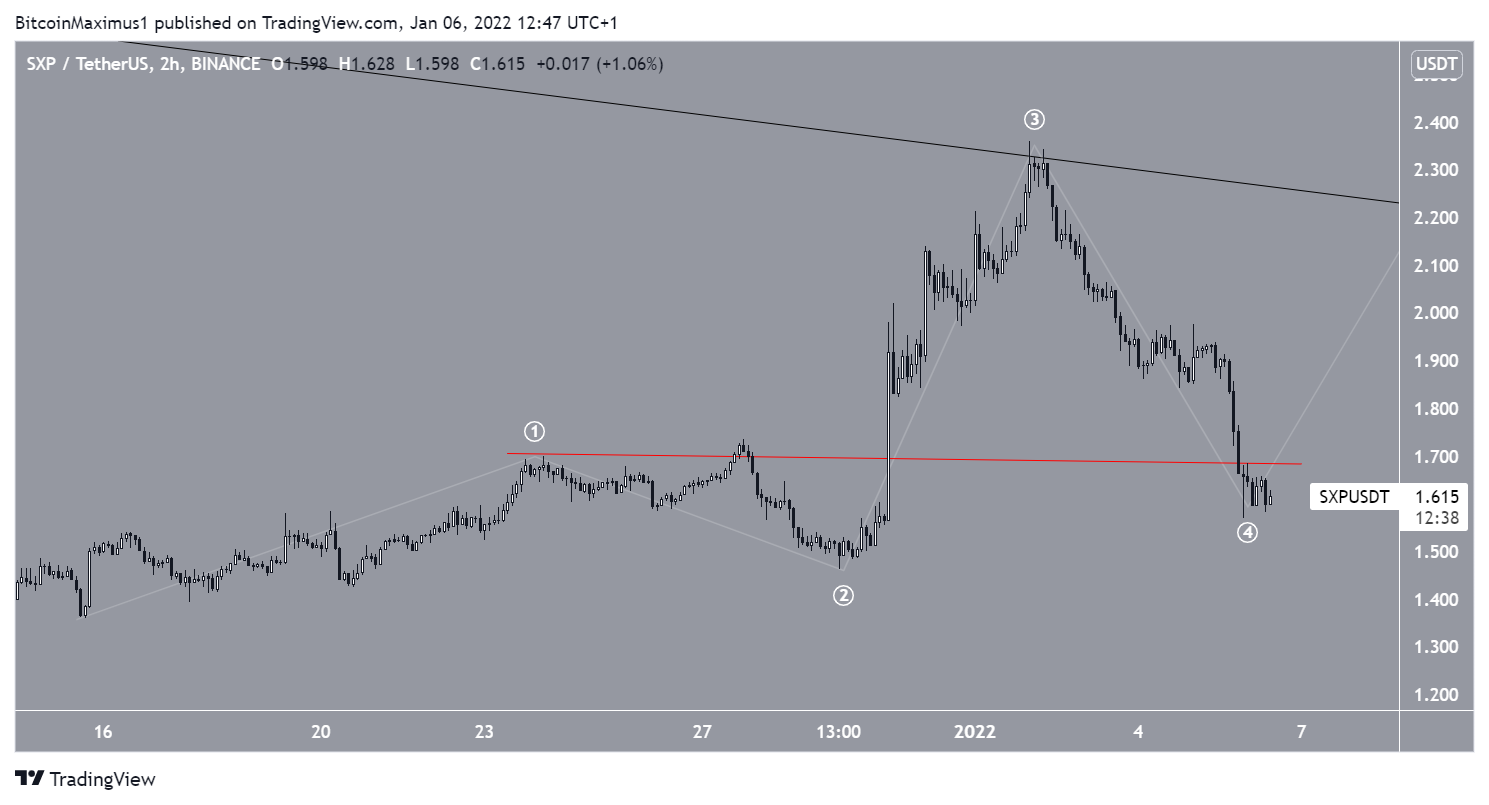
Cryptocurrency trader @Mesawine1 tweeted a SXP chart, stating that the upward movement is likely to continue after a short-term correction.
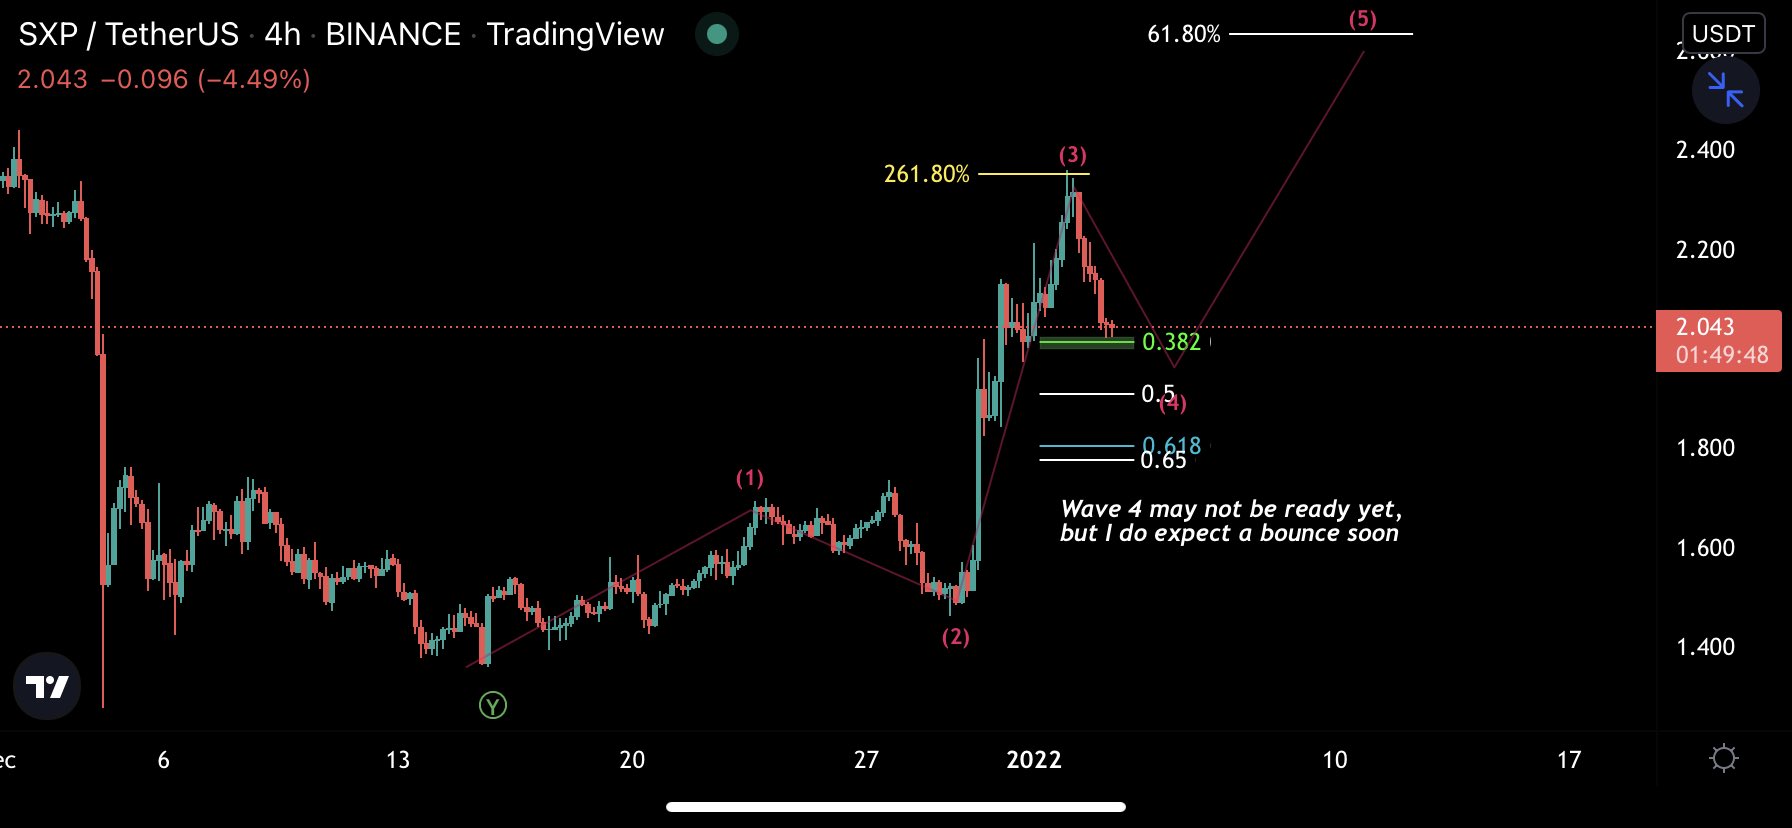
However, since the tweet, FTM has decreased below the $1.80 level and broken down from the wave 1 high (red line). Therefore, this invalidates the possibility that the upward movement was the beginning of the impulse.
Furthermore, it supports the possibility that SXP will eventually break down from the $1.50 horizontal support area.
For BeInCrypto’s latest Bitcoin (BTC) analysis, click here.
Disclaimer
All the information contained on our website is published in good faith and for general information purposes only. Any action the reader takes upon the information found on our website is strictly at their own risk.

