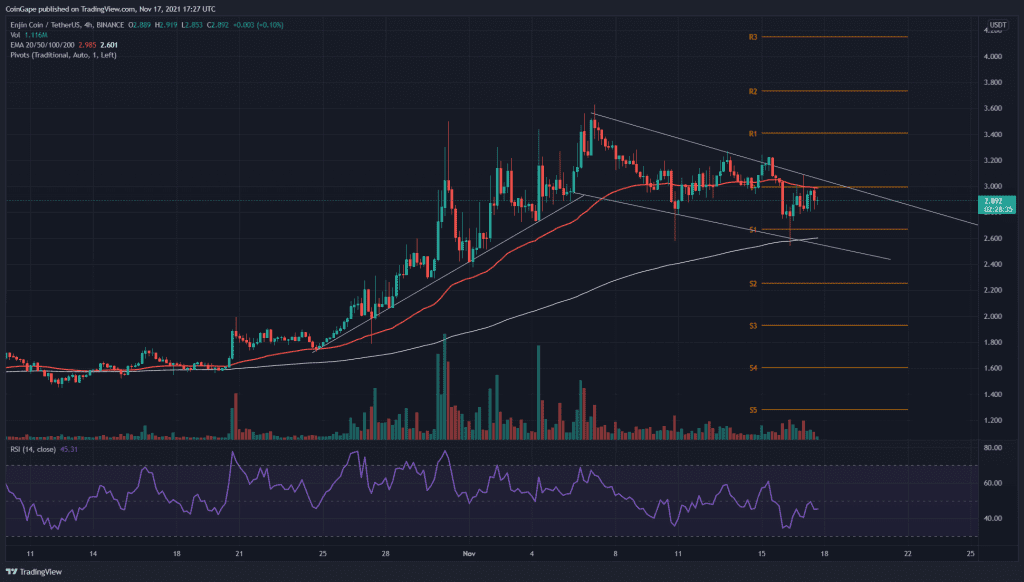
The ENJ token retraced up to 20% after facing resistance near the 3.5 mark resulting in a falling channel formation. However, the chances of the falling channel giving a bullish breakout increase as the technical indicators take the bullish side. Hence, buying at current prices has its risk; that is why the channel’s breakout can be an excellent buying time.
Key technical points:
- The ENJ token price action forms a falling channel in the 4-hour chart.
- The MACD indicator gives a bullish crossover in the 4-hour chart.
- The intraday trading volume in the ENJ token is $505 Million, indicating a 10% hike.
Source- ENJ/USD chart by Tradingview
The ENJ token shows retracement after facing the sudden increase in supply near the $0.35 mark. However, before the downfall, the support trendline in action makes a solid flag pattern in the 4-hour chart.
The Relative Strength Index value at 54 indicates a retracement to the 50% mark in the daily chart. Moreover, the RSI line also displays a hidden bullish divergence in the daily chart that increases the chances of a bullish breakout.
The MACD indicator also forecasts a bullish breakout of the parallel channel as the fast and slow lines give a bullish crossover in the 4-hour chart.
ENJ/USD Chart In The 4-hour Time Frame

Source- ENJ/USD chart by Tradingview
The ENJ token price recently fell after the double top pattern in the 4-hour chart. However, the support zone near the $2.75 mark helps halt the falling prices more than once. However, traders can observe the falling prices taking support near the $2.40 and $1.98. However, the breakout of the previously mentioned falling channel can find resistance near the $3.5 mark.
The ENJ token price action shows an upside retracement after finding demand near the $2.75 mark. Hence, we can shortly see the prices reach the $3.25 mark.


