After a bullish rally, the crypto-market demonstrated volatility and dynamically flipped on the lower side.
As the bears continually gathered force, altcoins like Cardano, XRP, and EOS registered double-digit losses on their weekly charts.
Cardano (ADA)
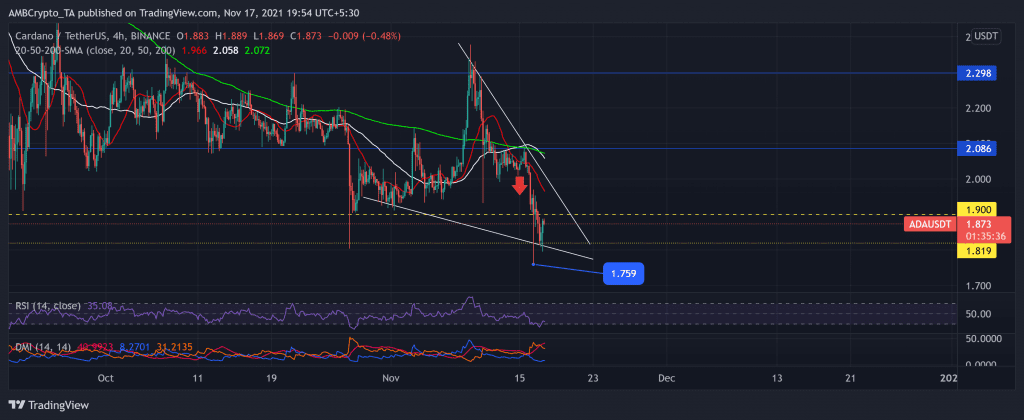
After striking its ATH on 2 September, ADA has steadily oscillated in a downtrend as the bulls failed to counter the sustained selling pressure. Until 8 November, the token continually slackened while it got flipped by Solana. After the same, the bulls triggered an uptrend to hit a one-month high.
However, they struggled to sustain this rally as the price dipped by 25.6% from 9 to 16 November. As a result, the bears pushed the prices below the 4-hour 20-50-200 SMA. Additionally, the price touched its three-month low on 16 November at $1.759.
As the bulls found support at the $1.8-mark, price action saw a slight revival over the past 24 hours. At press time, ADA was trading at $1.873. The RSI stood at the 35-mark, visibly depicting a seller’s market. Furthermore, the DMI affirmed RSI’s conclusion with a high directional trend.
XRP
Since 26 October, XRP has been on the ascent after fluctuating within the parallel channel. Soon after, the price rallied by nearly 35% to touch its two-month high on 10 November. Since then, however, the bulls have lost their ground and couldn’t counter the enormous sell-off.
Accordingly, the price breached the lower channel after recording a 17.5% correction over the last week.
While the bulls failed to counter the price at the lower trendline, bears found support at $1.0799. This pullback dragged the price below the 20-50-200 SMA, demonstrating a bearish inclination. Now, as bulls again try to breach the $1.126-mark, the near-term technical indicators gave mixed signals. At press time, XRP was trading at $1.0993.
The RSI was on a downtrend after essentially remaining below the half-line over the past week. Also, the DMI seemingly preferred the selling power. Nevertheless, the MACD and AO showed possible signs of easing bearish vigor if the bulls can gather momentum.
EOS
Since 11 October, EOS’s price action has undertaken a bullish trajectory as the price moved between the two parallel lines heading north. The digital currency saw a 20.9% rally over the next month. Consequently, EOS hit its seven-week high on 10 November and retreated between the parallel lines.
The altcoin saw a 25.03% withdrawal over the next week until it hit its seven-week low on 16 November. The near-term technicals resonated with the selling strength. At press time, EOS was trading at $4.361 after recording a slight revival over the past 24 hours.
The RSI was on a downtrend and showed no revival signs. Additionally, the DMI preferred the bearish influence. Nonetheless, the MACD and AO showed possible signs of easing bearish power if the bulls can gather momentum.


