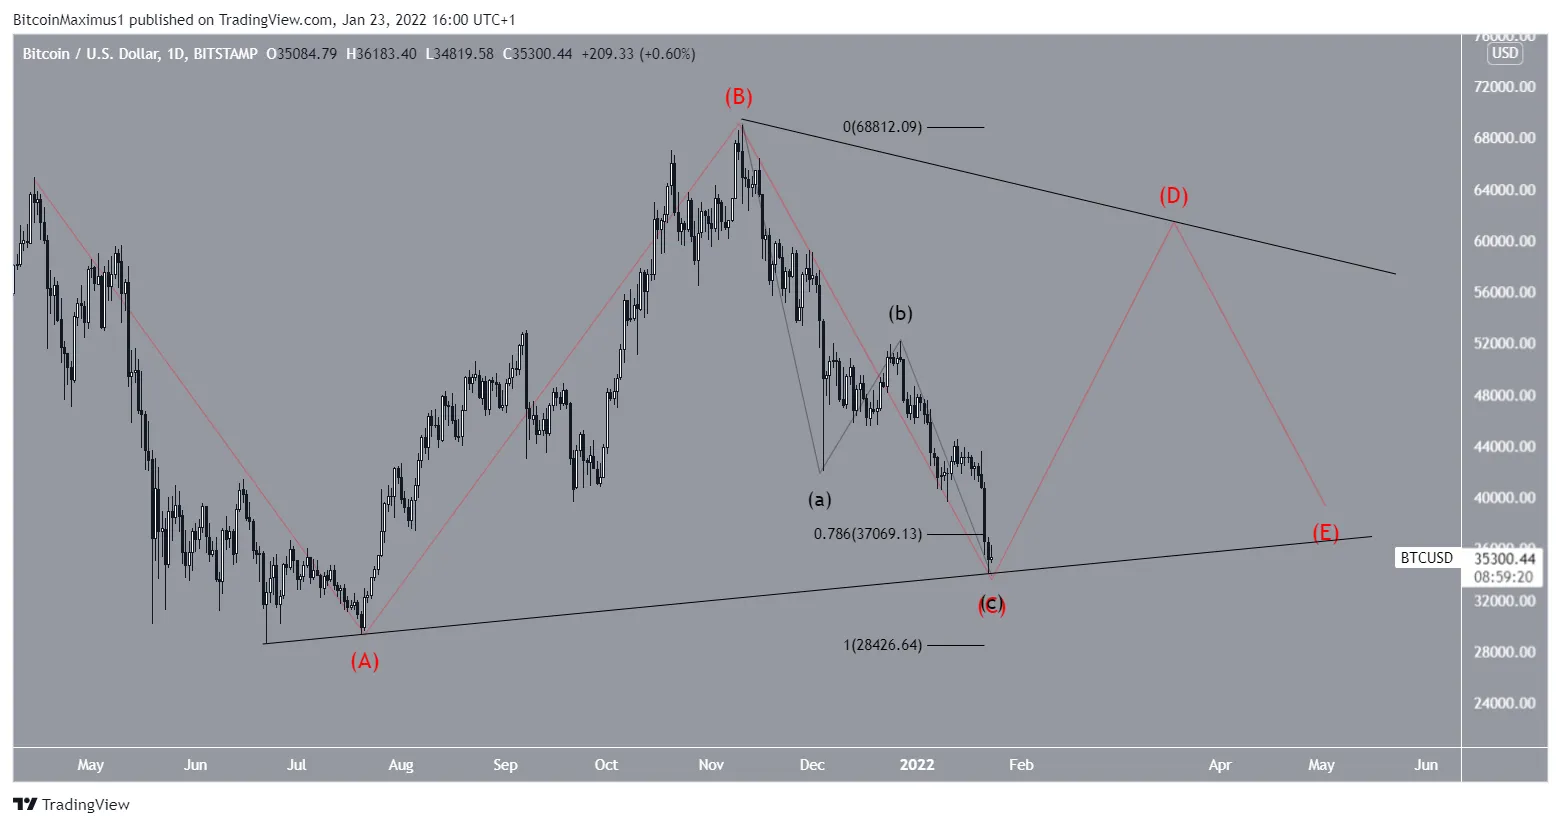
According to Elliott Wave theory, Bitcoin (BTC) has either reached the end of a correction that began in April 2021 or is very close to doing so.
Out of the three most likely scenarios for the short-term BTC movement, two of them suggest that a bottom has already been reached.
Long-term Bitcoin correction
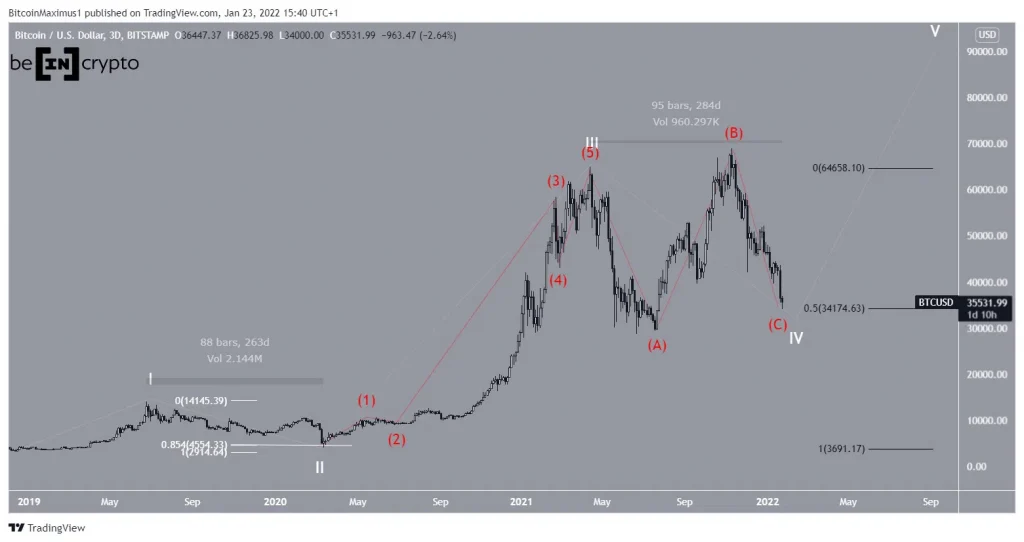
In December 2018, BTC began a five-wave upward move (white) that is still ongoing. If this is true, it’s now nearing the end of wave four. It’s common in these patterns that after another final upward movement follows to finish the final wave. The sub-wave count is shown in red below.
Waves two and four have had very similar lengths, with the former continuing for 263 days while the latter has so far developed for 284 days.
Due to the concept of alternation, there should be a distinct difference in these two waves in either time, complexity, or retracement.
Since wave two ended at the 0.85 Fib retracement level (white), it would make sense for wave four to be shallow, possibly ending at the 0.5 Fib retracement resistance level (black). This is where BTC is currently trading.
Potential short-term scenarios
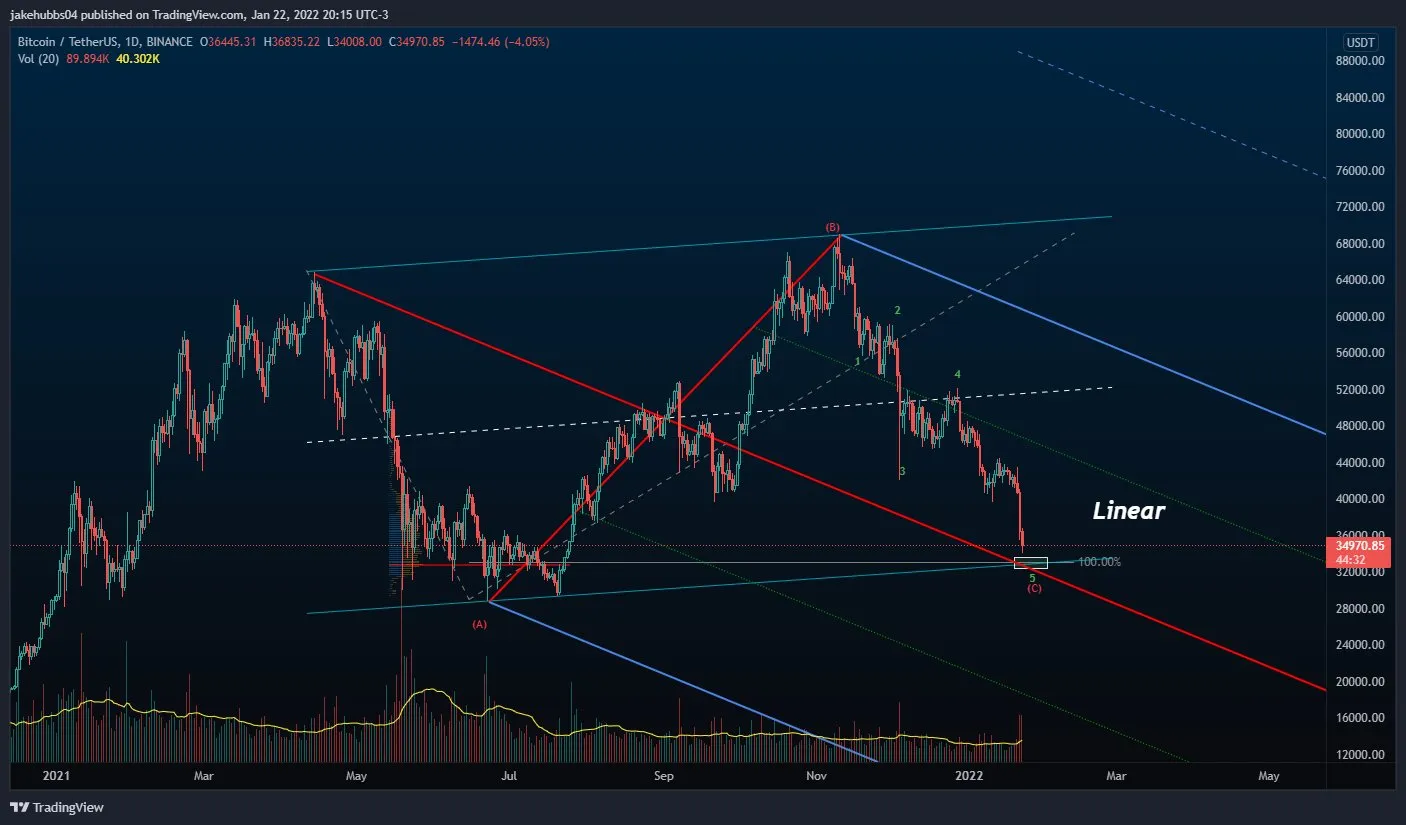
There are three main possibilities for the short-term future movement, and they all suggest that BTC is nearing the end of its correction. Cryptocurrency trader @TheTradingHubb tweeted a BTC chart, stating that the correction should soon be complete.
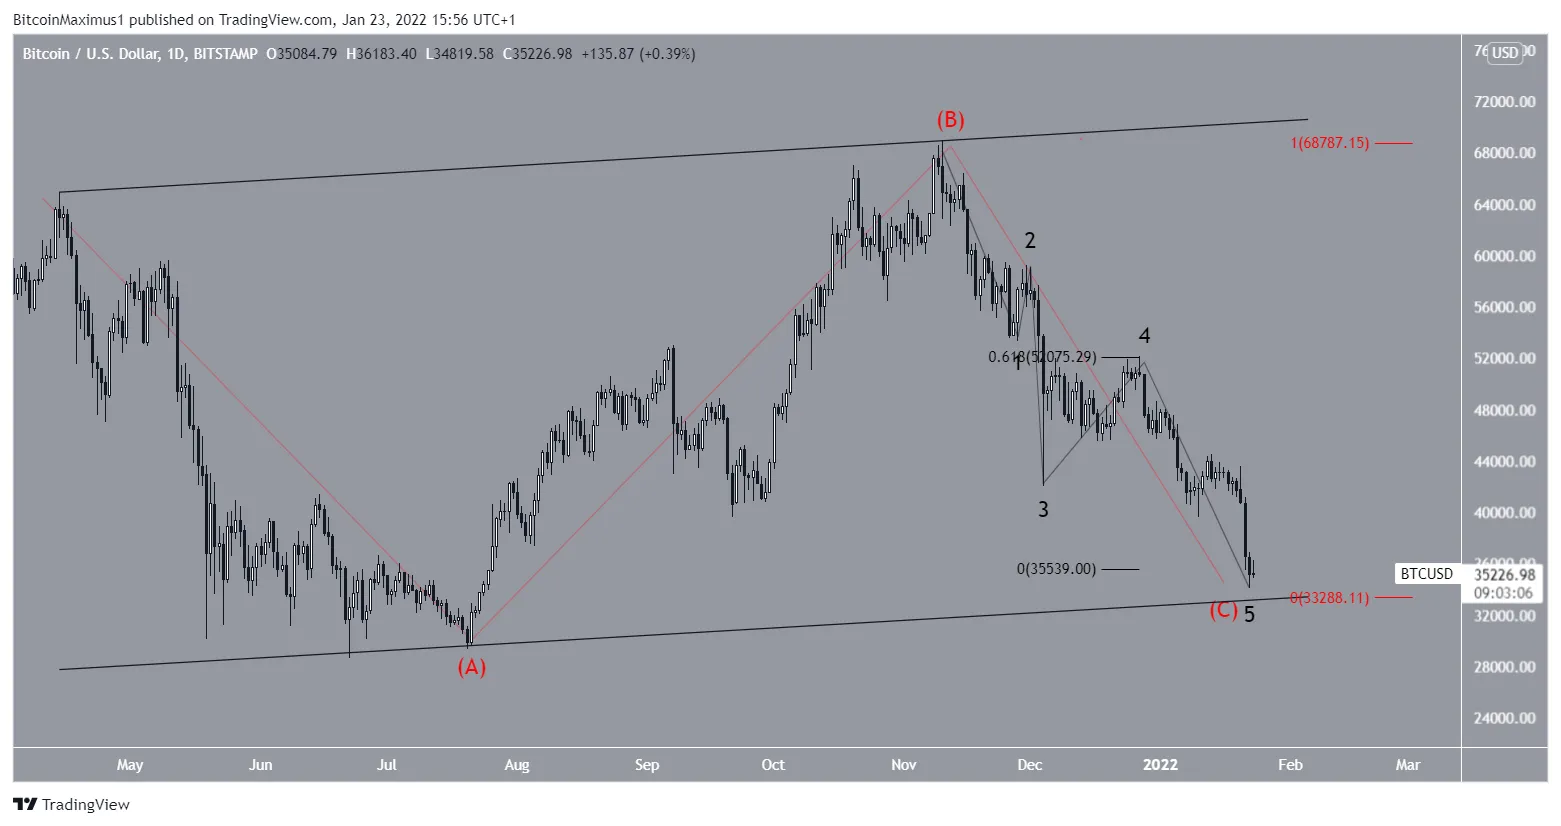
The scenario outlined in the tweet is that of a regular flat correction. In this pattern, BTC looks to be in wave C (red), which would complete the corrective phase at the $33,300 support level.
A low near $33,300 would give waves A:C a 1:1 ratio (red). In addition to this, it would coincide with the support line of an ascending parallel channel that contains the entire movement since April.
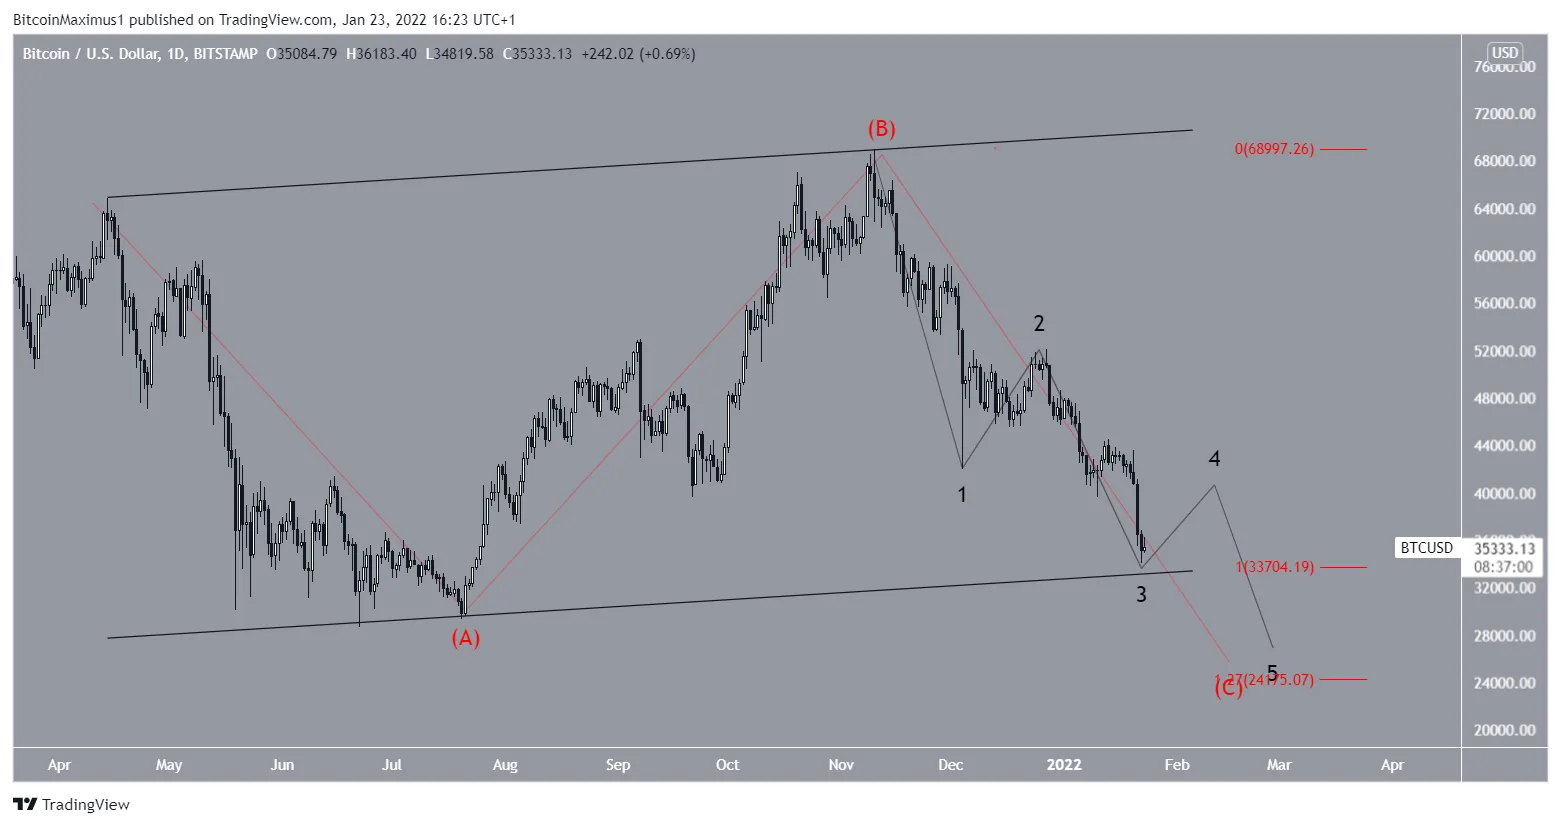
The second possibility is that BTC is completing wave four in an expanded flat correction. In such corrections, wave C is most often 1.27 or 1.61 times longer than wave A.
The 1.27 target would lead to a low of $24,175. If correct, BTC could rebound to complete sub-wave four (black), and then decrease once more, completing the final drop.
The 1.61 target is found at $12,175. A drop to this level would invalidate the entire bullish structure because wave four would dive back into wave one territory. Therefore, it seems unlikely to fall that deep.
Triangle scenario
The final likely possibility is that BTC is completing a contracting fourth wave triangle.
One of the main rules of the triangle is that each wave should not retrace much more than the 0.786 Fib retracement level. Currently, the prospective wave C has already done so. Therefore, it’s imperative that it reaches a bottom at the current level and reverses its trend.
The short-term movement, in this case, would be similar to that of the regular flat correction mentioned above.
However, the price would likely still need to consolidate for a long period of time before eventually breaking out.
For BeInCrypto’s latest Bitcoin (BTC) analysis, click here.
Disclaimer
All the information contained on our website is published in good faith and for general information purposes only. Any action the reader takes upon the information found on our website is strictly at their own risk.

