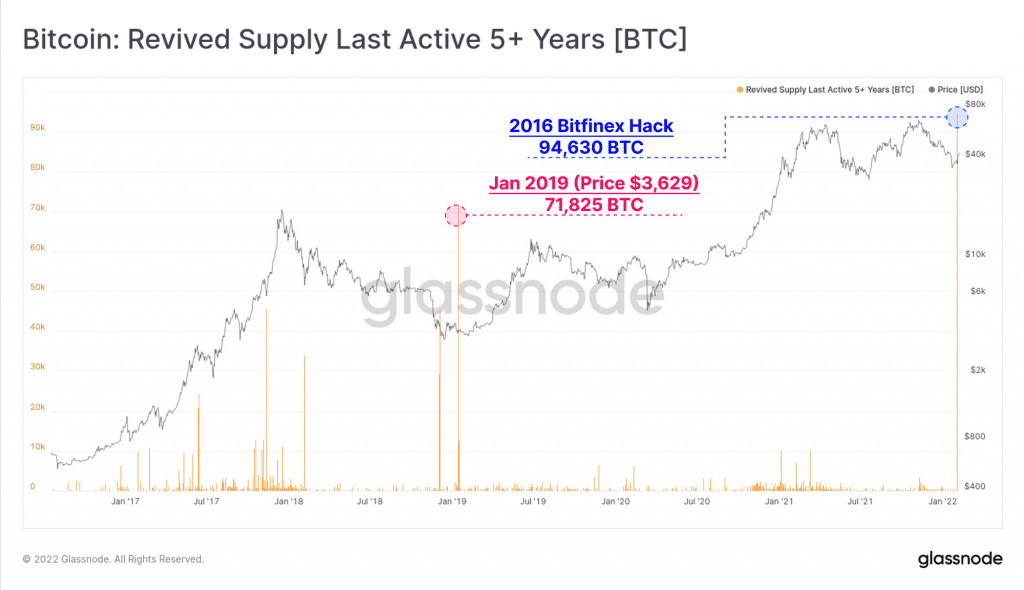
Bitcoin on-chain data shows the recent movement of the coins involved in the 2016 Bitfinex hack have showed up as the largest ever spike in the 5+ years old supply revival metric.
Movement Of 2016 Bitfinex Hack Coins Revived The Largest 5+ Years Old Bitcoin Supply
As per the latest weekly report from Glassnode, the largest ever spike in the 5+ years old supply revived metric was observed recently.
The “revived supply last active 5+ years” is an indicator that measures the amount of supply moved during a specific period that was more than 5 years old.
Such old coins make up for the dormant part of the Bitcoin supply. These coins may belong to wallets that have been lost, or the stored supply on exchanges. Some of the supply may also be owned by whales who came into the crypto early.
When the value of this indicator spikes up, it means a large number of these old coins have been sold. This can be bearish for the price of Bitcoin.
Related Reading | Shiba Inu Again Outperforms Dogecoin This Week With Double Its Gains
Now, here is a chart that shows the trend in the metric over the past five years:
Looks like the indicator has observed a huge spike recently | Source: The Glassnode Week Onchain - Week 6, 2022
As you can see in the above graph, the largest ever number of coins belonging to the 5+ years Bitcoin supply was moved recently.
The spike, amounting to 94,630 BTC, is made up of coins that were involved in the 2016 Bitfinex hack. Whoever was behind the hack was keeping the coins stationary till now as cashing out on them all at once would catch a lot of attention. Now it seems these coins have been moved to a new address.
Related Reading | Jack Dorsey Deems Diem Project A Waste Of Time, Suggests Meta To Focus On Bitcoin
The largest spike before this was back in January 2019, when around 71,825 BTC was sold. The price of the crypto then was around $3.6k.
BTC Price
At the time of writing, Bitcoin’s price floats around $43.8k, up 14% in the last seven days. Over the past month, the crypto has gained 5% in value.
The below chart shows the trend in the price of BTC over the last five days.

BTC's price seems to have surged up over the last few days | Source: BTCUSD on TradingView
Bitcoin has finally shown some solid recovery as the crypto has enjoyed some sharp uptrend over the past week. Earlier today, the coin briefly broke above the $45k mark before falling down to the current levels.
Currently, it’s unclear if this trend of upwards movement will last or if it’s just a bull trap. However, some indicators do suggest that the bottom may now be in.
Featured image from Unsplash.com, charts from TradingView.com, Glassnode.com


