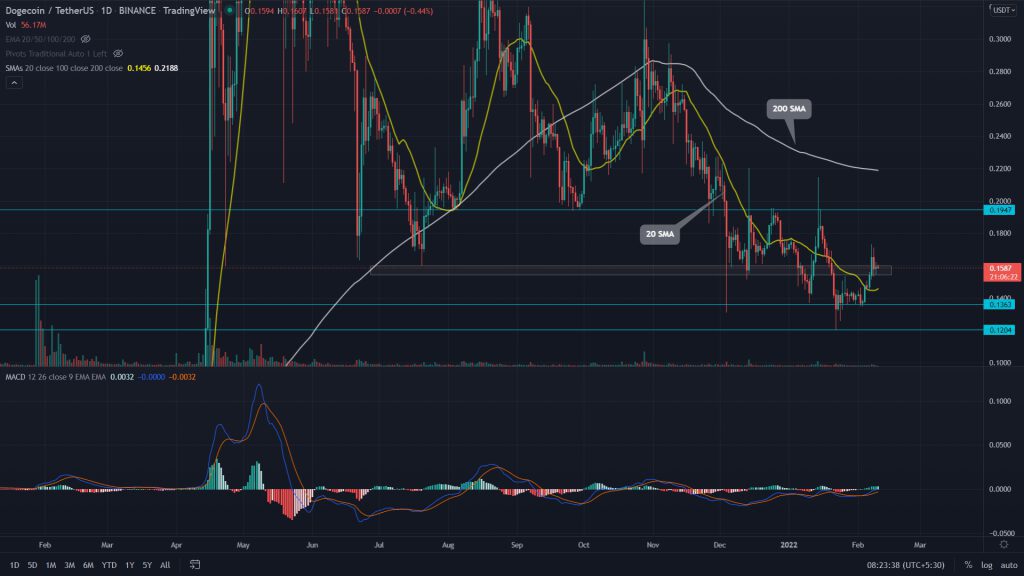
On Feb. 4th, Dogecoin (DOGE) price rebounded from the $0.136 support with daily-morning star candle. The buyers managed to poke the nearest resistance of $0.16, indicating an 18% weekly gain. However, crypto investors should wait until the memecoin shows sufficient sustainability at this level, confirming a recovery opportunity.
Key technical points
- The Dogecoin buyers fail to sustain above the 50-day EMA
- The 24-hour trading volume in the Dogecoin coin is 768 Million, indicating a 45.5% loss.
Source-Tradingview
During early February, the DOGE price was still trapped below the flipped resistance of $0.144. However, with the widespread recovery in the crypto market, the bulls gave a decisive breakout from this overhead resistance, initiating a minor relief rally.
The buyers surged to the immediate resistance of $0.16, indicating a 38% gain in less than three weeks. However, the coin chart shows higher price rejection candles at this level, indicating the sellers mount stiff resistance.
The DOGE/USD pair trading below the 50, 100, and 200 DMA line maintains a bearish trend. However, the recently reclaimed 20 EMA should bolster the bulls in buying dips.
The Moving average convergence divergence indicator shows the MACD and signal lines are poised to break above the midline. The steady growth in the Histogram chart with its green bars accentuates the rising underlying bullishness.
DOGE Price 4-hour chart

Source- Tradingview
If sellers impose strong supply pressure at the $0.16 level, the coin price would revert and plunge to the near support of $0.43. This reversal would indicate the bears are still selling on rallies, threatening the downtrend would continue
On a contrary note, if a buyer could defend the $0.16 mark, the memecoin would surge to the overhead resistance of $0.2, which is the key hurdle to confirm bullish recovery in DOGE.
- Resistance levels- $0.16 and $0.195
- Support levels- $0.143 and $0.12


