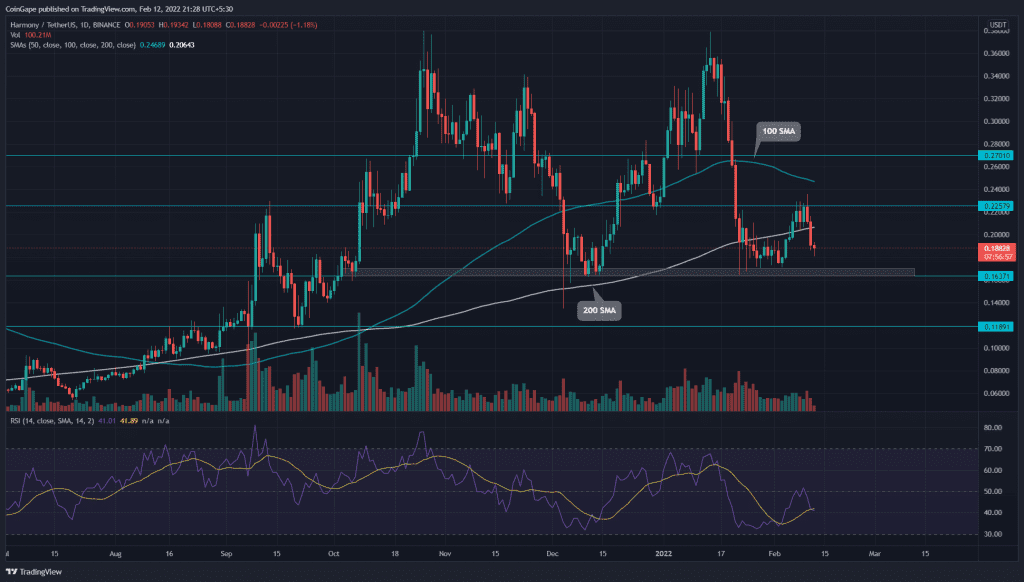
The Harmony (ONE) buyers’ recovery rally failed to surpass the immediate resistance of $0.225. The ONE price reverts and charges towards the previous lower low support of $0.163. If altcoin plunged below this bottom support, it would indicate the bears are selling on rallies, signaling the resumption of the downtrend.
Key technical points:
- The ONE buyer’s lost the 200-day SMA
- The 24-hour trading volume in the Harmony coin is $192.9 Million, indicating a 3.6% loss.
Source-Tradingview
Last week’s recovery rally in the ONE/USD pair turned down from the $0.225 resistance and slid below the 200-day SMA($0.2) on Feb 11. Currently, the coin price trades at $0.187, indicating a 16.8% fall in the last three days.
The ONE price would soon retest the monthly support of $0.163 to confirm if buyers are accumulating at this mark or there’s more in correction.
It is crucial for ONE buyers to defend the $0.163 support because a breakdown and closing below it, could intensify the selling pressure, and sink the altcoin 28% down to the $0.118 mark.
However, if they succeed rebound the altcoin from the bottom support, the buyers will make another attempt to challenge the $0.225 resistance. Furthermore, a genuine breakout from this resistance would give a positive signal for trend reversal.
The technical chart indicates the important supply regions are $0.225 and $0.27. Moreover, the demand can be expected at $0.163 and $0.12.
Technical indicators:
Due to the recent reversal, the 50-day SMA failed to cross above the 100 SMA line. Moreover, both these lines sloping downwards indicate the bears are dominant.
- The daily-Relative Strength Index reenters the negative territory, suggesting a bearish sentiment among the market participants.
- The 4-hour Bollinger band indicator moving sideways accentuates the short-term consolidation between the $0.225 and $0.163.


