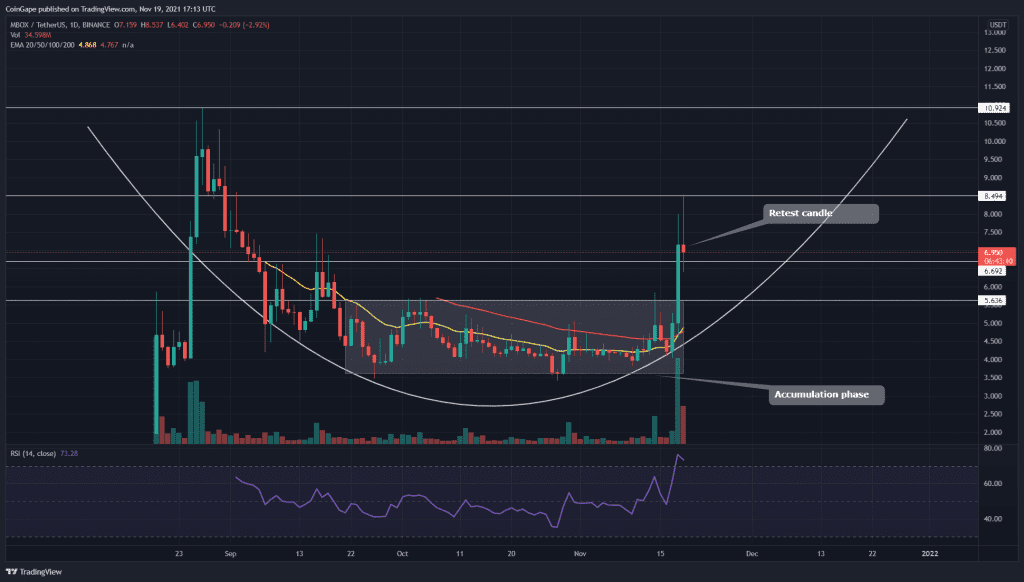
For around two months, the MBOX price was trapped in an accumulation phase. After struggling at this lower level, the token finally obtained enough bullish momentum to initiate a significant rally, which showed a 118% high in three trading days. The token is currently trying to retest a significant price level to continue its rally. Can you enter at this level?
Key technical points:
- The MBOX token forms a rounding bottom pattern in the daily time frame chart
- The MBOX chart displays a bullish crossover of the 20-and-50-day EMA
- The intraday trading volume in the MBOX token is $1.09 Billion, indicating a 39% hike
Source- MBOX/USD chart by Tradingview
Since the sudden fall of September, the MBOX token price has never seen what’s above the $5.63 resistance. The token kept resonating between the $3.4 and $5.6 mark for around two months, indicating a boring accumulation phase.
However, on 18% November, the MBOX price finally gave a deceive breakout from overhead resistance, initiating a significant rally and a good possibility of forming a rounding bottom pattern, which has a neckline at the $11 mark.
The technical chart also shows a bullish crossover of the 20 and 50 EMA lines, providing more confirmation for this rally. The Relative Strength Index(75) has shown significant growth in its value.
MBOX/USD Chart In The 4-hour Time Frame

Source- MBOX/USD chart by Tradingview
This new rally of MBOX token has shown a high 118% in just three trading days, breaching two significant resistance levels of the $5.6 and $6.7 mark. The token price is currently in a retest phase and will try to obtain proper support for either of these levels.
Thus, crypto traders can grab a great long opportunity for them if the price displays sufficient demand pressure from these supports. The current price of the MBOX token is 7.01, with an intraday loss of 1.96%.


