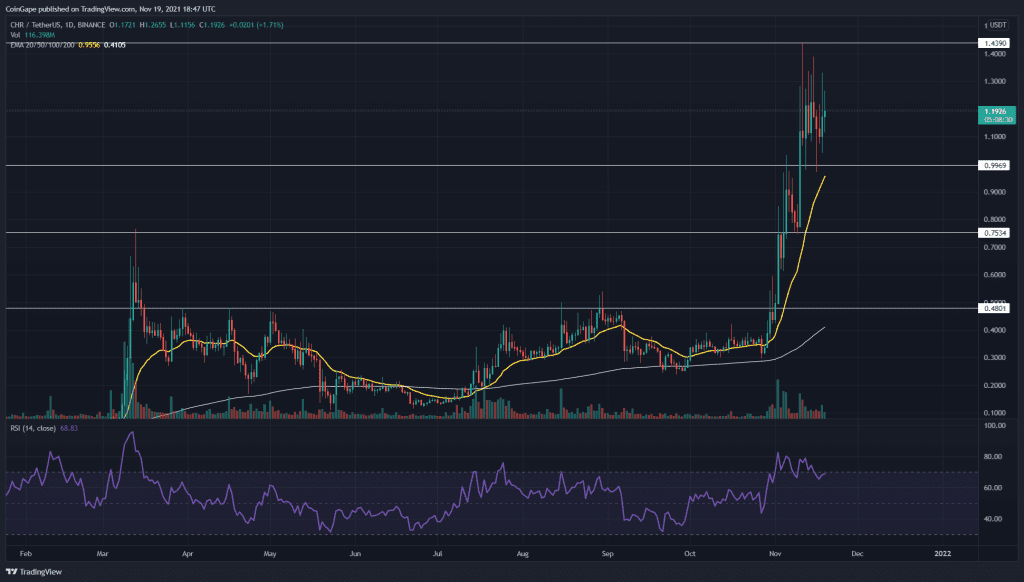
The technical outlook for CHR/USD chart shows a strong uptrend. The token initiated a new rally in November, which so far made a high of 240%. A positive news that captured the interest of the crypto investor in this token would be the partnership announcement between Chromia and Revolve games. However, the token price is currently in a retesting period.
Key technical points:
- The CHR token forms a symmetrical triangle pattern in the 4-hour time frame chart
- The daily RSI indicates a bearish divergence regarding the CHR price
- The intraday trading volume in the CHR token is $378.1 Million, indicating a 34% hike
Source- CHR/USD chart by Tradingview
On November 1st, the CHR token breached a formidable resistance level of $0.48, which has dominated the token price since March ‘21. With this breakout, the token initiated a significant rally that broke the previous All-Time high resistance of 0.75 and continued moving forward.
As far now, the CHR token has made a new ATH level of $1.43 mark. After the token was rejected from this level, the price started resonating in a tight range, stretching from $1 to $1.43 level.
The Relative Strength Index(68) maintains a positive sentiment for the token. However, the RSI chart has also displayed a bearish divergence, indicating decreasing strength of crypto buyers.
CHR/USD Chart In The 4-hour Time Frame

Source- CHR/USD chart by Tradingview
The CHR token price displays a symmetrical triangle pattern in the 4-hour time frame chart. The crypto traders would get an excellent trading opportunity in this token once the price provides a proper breakout from either of its trendlines.
In case the price gives a bullish breakout from this pattern, the Fibonacci extension levels say the possible resistance level above the ATH level is $1.57( 0.5 FIB), followed by $1.7(0.6180 FIB) and 1.9(0.786 FIB)


