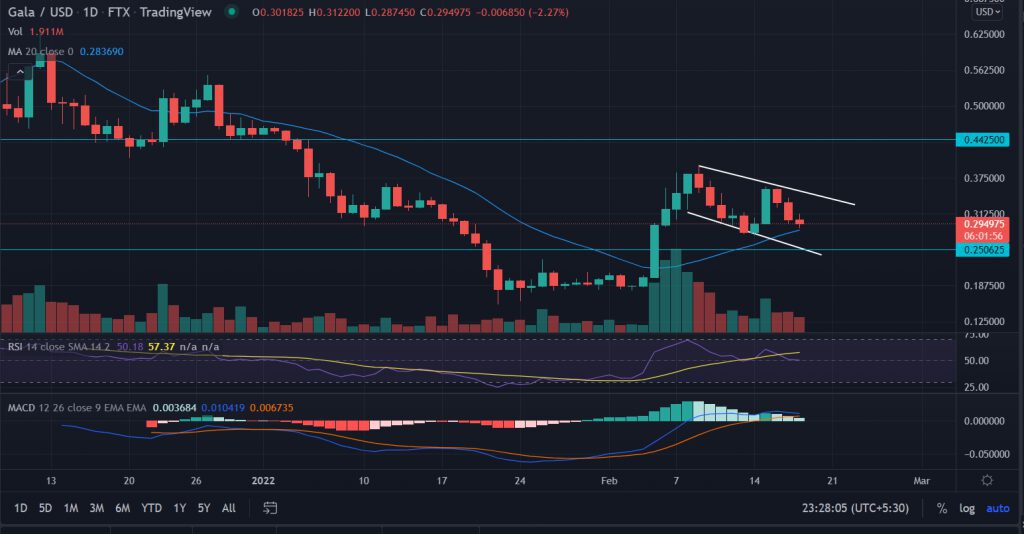
Gala Games (GALA) price extends the previous session’s losses as the weekend begins. GALA trades in a tight range with the formation of a ‘Doji’ candlestick. This indicates indecision among investors, which can be concluded as a critical point for the next price action.
- Gala Games (GALA) falls for a third consecutive session on Friday.
- A decisive break below the 20-day SMA would drag the price toward $0.24.
- Investors seek breakout above the flag formation to set up bullish bias.
As of writing, GALA/USD is trading at $0.29, down nearly 2% for the day.
GALA wavers inside flag formation
On the daily chart, GALA price action has devalued more than 80% from the November highs of $0.84. GALA has touched an all-time low on January 22 at $0.15. Investors find some attractive buying opportunities near the mentioned level.
But the price trades near the 20-day Simple Moving Average (SMA) at $0.22 with a bearish bias. A daily close below this level could trigger the sell-off toward the $0.25 level followed by the critical $0.16 level.
On the flip side, the ‘flag formation’ is a bullish reversal pattern that suggests bulls are not in a mood to give up easily. The 30% retracement from the swing tops gives bulls hopes to retest the upper trend line of the flag formation at $0.34.
Fresh buying vigor is required to cross above February 9 highs of $0.39 that coincides with the beginning of the mentioned pattern. Next, the market participants could test the $0.44 horizontal resistance zone.
Technical Indicators:
RSI: The Daily Relative Strength Index (RSI) seeks double support near 49 with a neutral stance.
MACD: The Moving Average Convergence Divergence (MACD) holds above the midline supporting the underlying bullish current.


