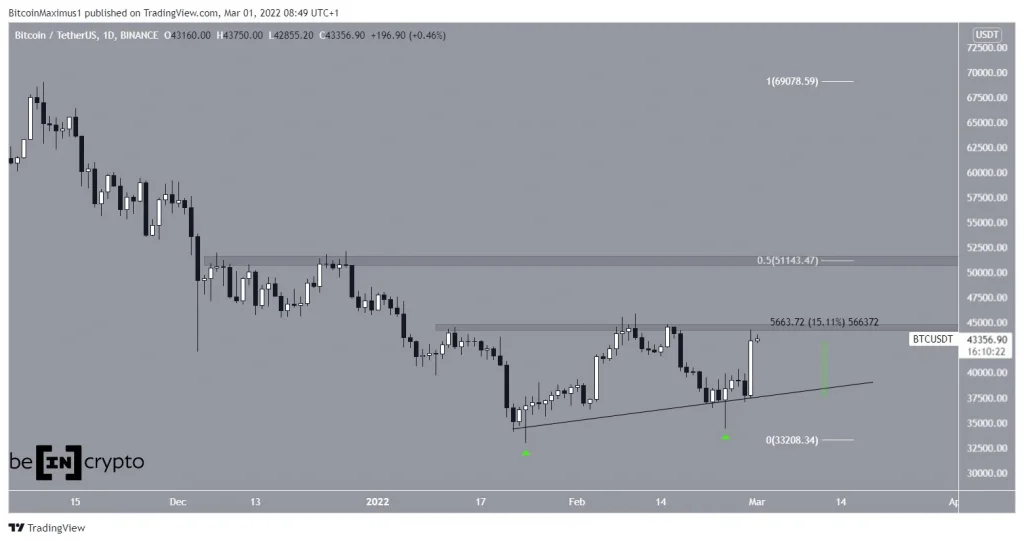
Bitcoin (BTC) increased significantly on Feb 28 and its RSI and MACD are close to generating a strong bullish signal.
Bitcoin has been moving upwards since Jan 24 and looks to be following an ascending support line.
The line has been validated several times so far. On Jan 24 and Feb 24 BTC nearly broke down from this support but created a very long lower wick and reclaimed the line shortly after.
On Feb 28, BTC increased considerably and created a bullish candlestick with a magnitude of 15%. Measuring its magnitude, this was the largest bullish candlestick in more than a year.
The closest resistance levels are found at $44,400 and $51,150. The latter is the 0.5 Fib retracement resistance level and a horizontal resistance area, making it very significant.
Indicators give bullish signal
Technical indicators in the daily time frame are bullish. This is especially evident by the RSI cross above 50 (green icon). The RSI is a momentum indicator and readings above 50 are normally considered signs of a bullish trend.
Furthermore, the MACD, which is created by short and long-term moving averages (MA), is increasing and is nearly positive. This means that the short-term MA is nearly faster than the long-term average.
The previous time that the RSI was above 50 while the MACD was also positive was in October 2021, when BTC was increasing towards its all-time high.
In early February 2022, when the RSI was above 50 (red circle) but the MACD was negative, BTC failed to sustain its upward movement.
Therefore, it’s crucial that the MACD moves into positive territory in order for the upward trend to be confirmed. This could also cause BTC to break out above $44,400.
It’s even more interesting that the RSI has not yet even crossed into overbought territory, which usually occurs prior to a reversal.
Therefore, the daily and six-hour time frames provide bullish outlooks that suggest the upward movement will continue.
BTC wave count
The long-term wave count still remains unclear.
As for the short-term analysis, there are still two main possibilities.
The first suggests that the ongoing increase is part of an A-B-C corrective structure. In it, waves A and C have had an exact 1:1 ratio. This suggests that the upward movement has potentially come to an end.
However, the fact that the top of wave C has moved above the resistance line of the current ascending parallel channel casts some doubt on this possibility.
An increase above the $45,850 local high (red line) of Feb 10 would invalidate this wave count.
The bullish count suggests that the increase is part of a five-wave upward move which could lead to new highs. In it, BTC is currently in wave three.
If BTC manages to hold on above the resistance line of the channel and create a horizontal corrective pattern, it would suggest that this is the correct count.
A fall below the wave one high at $40,330 would invalidate this particular wave count.
For BeInCrypto’s previous Bitcoin (BTC) analysis, click here
Disclaimer
All the information contained on our website is published in good faith and for general information purposes only. Any action the reader takes upon the information found on our website is strictly at their own risk.


