Ekta is a brand new decentralized protocol that creates a bridge between physical reality and the virtual world. It is based on blockchain technology to tokenize tangible assets. Ekta shares their motto as, “profit with purpose”, and therefore organizations and creators can tokenize and sell their assets through metaverse, NFT, Defi, exchange solutions on Ektachain.
Let us study the EKTA/USDT technical chart to understand the price behavior
100-day EMA Bolstered The Buying Pressure
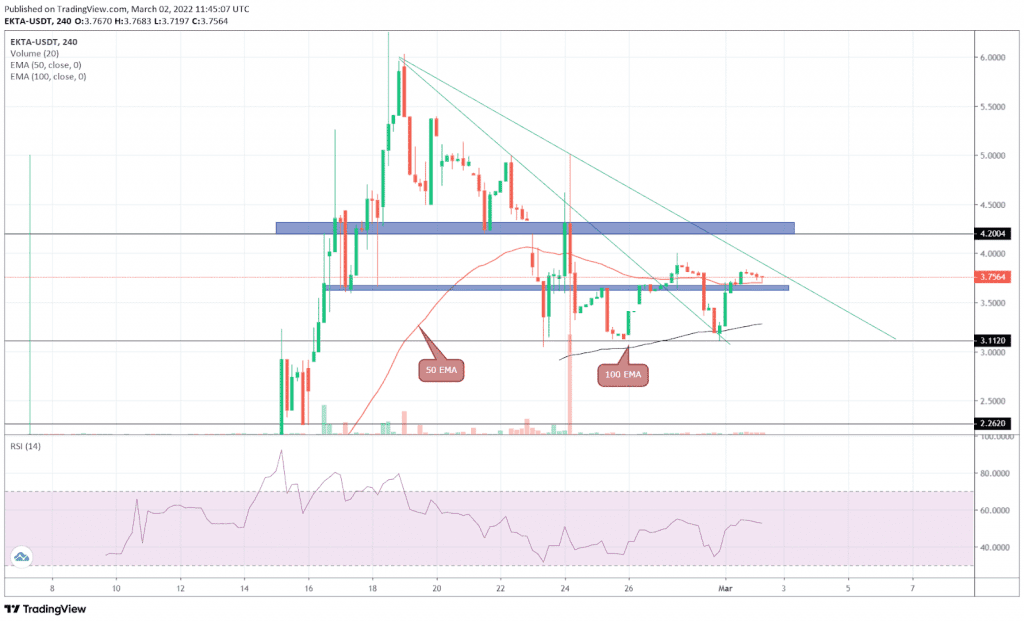
The EKTA/USDT pair turned back from the $4 psychological level in order to retest the breached trendline. The buyers meet a confluence of major technical support, i.e., horizontal level($3), 100-day EMA, and descending trendline at this mark, mounting stiff support for the buyers.
The buyers rebounded from the $3 support and breached the $3.68 resistance, registering a 20.5$ gain. Over the week, the EKTA price has bounced trice from this bottom support, indicating a strong accumulation zone for traders.
The buyers are trying to sustain above the $3.68 mark, displaying lower price rejection candles. If they succeed, the bulls would drive the price 12% higher, reaching the $4 mark. A breakout and closing above this level would provide better confirmation for trend reversal.
By the press time, the current price of the EKTA token is trading at $3.39, and the 24hr volume change is $171.8K. The CoinGecko data shows the token stands at #656 rank with its current market cap of $40.03 Million.
Technical indicator
The EKTA price trading above the 100-day EMA maintains a bullish trend. Moreover, the buyers have recently reclaimed the 50-day EMA, providing an additional edge to long traders.
The Relative Strength Index(38) slope surged into the negative territory, signaling a bullish shift in traders’ sentiment.
- Resistance levels- $3.5, $4
- Support levels- $3, $2.2


