Disclaimer: The findings of the following analysis are the sole opinions of the writer and should not be considered investment advice
Swiss cryptocurrency ADA witnessed a surge of nearly 100% within seven days in early February 2021. However, post-August, investors’ interest seems to have waned a little. Curiously, after February 2022, the coin has been siding with the bulls. In fact, according to a couple of on-chain metrics, there are convincing arguments that Cardano could be a good asset to buy for a bull run as a longer-term investment.
However, it’s important to note that the short-term outlook for Cardano was bearish. After it failed to breach $1 in the past couple of days, ADA slipped back beneath the $0.9 mark. Furthermore, it could see a further downside as the price searched for demand. Interestingly, in the past 24 hours, the open interest behind Cardano has fallen in the markets, alongside the price itself. This suggested that the short-term bearishness could be a pullback rather than a strong downward move.
ADA- 1H
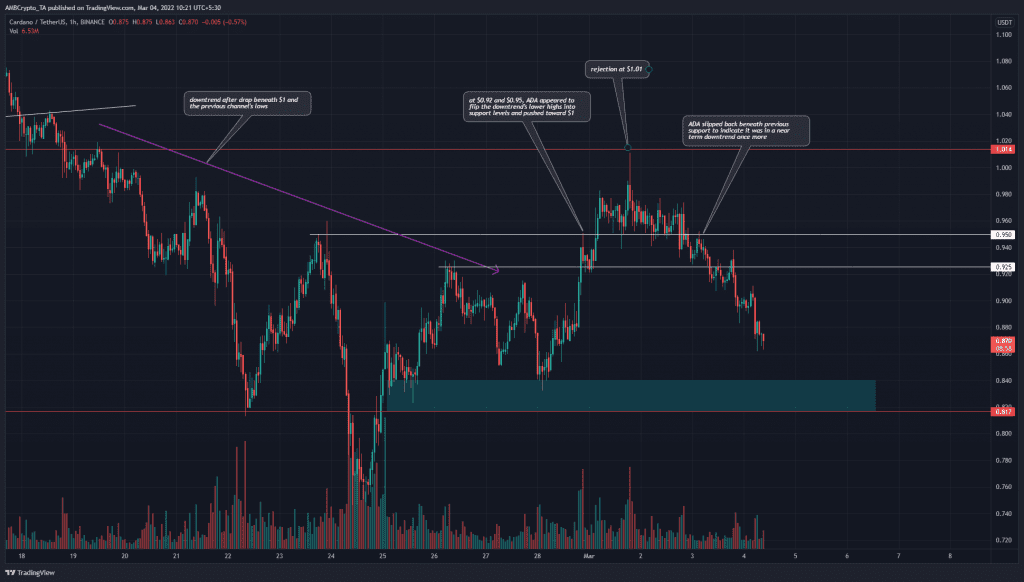
As the charts show, the price breached $0.925 and $0.95 in late February and the bulls were encouraged when ADA flipped $0.95 from resistance to support. However, just as Bitcoin itself faced some resistance near $45,200, so too did ADA at $1.
Sellers were quite strong above $0.98 and the price was decisively rejected and subsequently forced back beneath $0.95 and $0.925.
The 24 hours that preceded press time saw ADA lose 7.4% and flip $0.925 to resistance. To the south, the $0.817-$0.84 area (cyan box) could be revisited in search of demand.
Rationale
The RSI has been trending lower down the charts since the rejection at $1 and stood at 30.98 at the time of writing, which was on the verge of oversold. This by itself does not mean the price will soon see a bounce. Alongside the RSI, the Awesome Oscillator also showed that bearish momentum has been strengthening in the past couple of days.
The OBV has also steadily slipped lower down the charts.
Conclusion
The price action and the indicators painted a bearish picture for Cardano. Another drop amounting to nearly 5% would see ADA within the $0.84 region marked on the charts. While the $0.84 area could turn out to be a buying opportunity, risk-averse buyers might need to sit this one out. The near-term market structure has flipped to bearish once more and buying at $0.84 would be a contrarian trade and not a trend-following trade.


