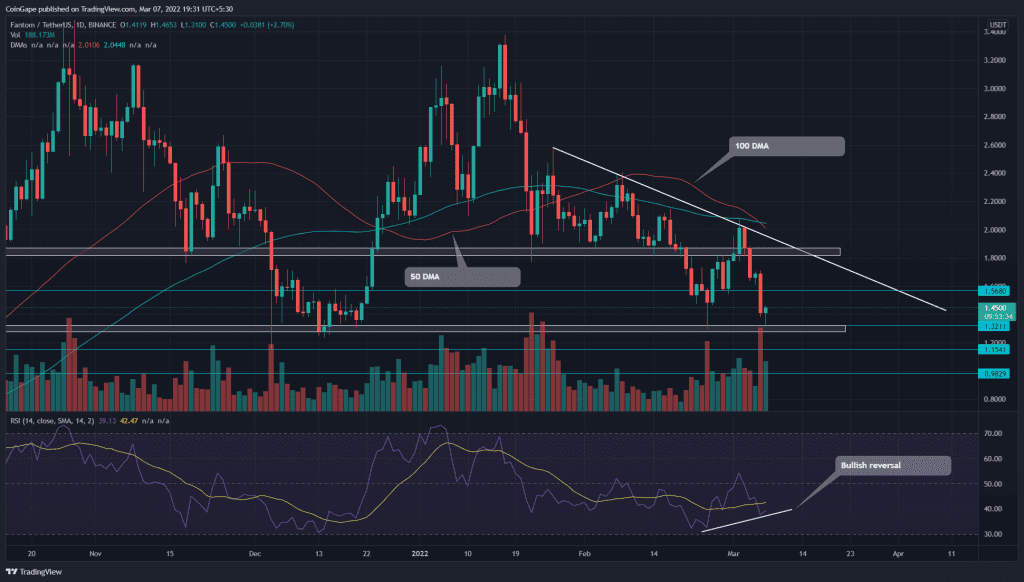
On March 3rd, the Fantom (FTM) recovery rally turned down from the descending trendline($2). This bearish reversal tumbled the altcoin by 34.7%, bringing it back to $1.3 bottom support. However, the buyers aggressively defend this level, suggesting a dip opportunity for traders.
Key points
- The FTM price shows lower price rejection at $1.3 support zone
- FTM chart shows a negative crossover of the 50 and 100 DMA
- The intraday trading volume in the FTM Network coin is $2 Million, indicating a 38.2% gain
Source-Tradingview
On March 1st, the Fantom (FTM) price gave a bullish breakout from the $1.8 resistance. The relief rally made a high of $2.08, but the buyers couldn’t sustain at this higher level and reverted from the descending trendline.
This reversal triggered a fakeout from the $1.8 level, trapping the aggressive buyers on March 4th. The bear trap accelerated the selling pressure and slumped the coin back to $1.3 support. As the altcoin retests its monthly support level ($1.3), all gains made by traders during last week’s recovery are nullified.
The FTM price trading above the 200 SMA line indicates an overall bearish trend. Moreover, a bearish crossover of the 50 and 100 DMA could attract more sellers in the market.
Descending Trendline Hammers Down The Recovery Efforts

Source-Tradingview
The FTM/USD pair turns green today, registering an 8.68% gain from the $1.3 support. A long-tail hammer candle at this support indicates the buyers are accounting at this dip, suggesting a possible reversal.
The daily-Relative Strength Index(38) shows an evident positive divergence concerning the previous swing low, bolstering a bullish reversal.
Anyhow, the buyers need to overcome the dynamic resistance trendline to initiate a genuine recovery in Fantom.
- Resistance level- $1.45-1.5 and $1.8
- Support levels- $1.3 and $1.15


