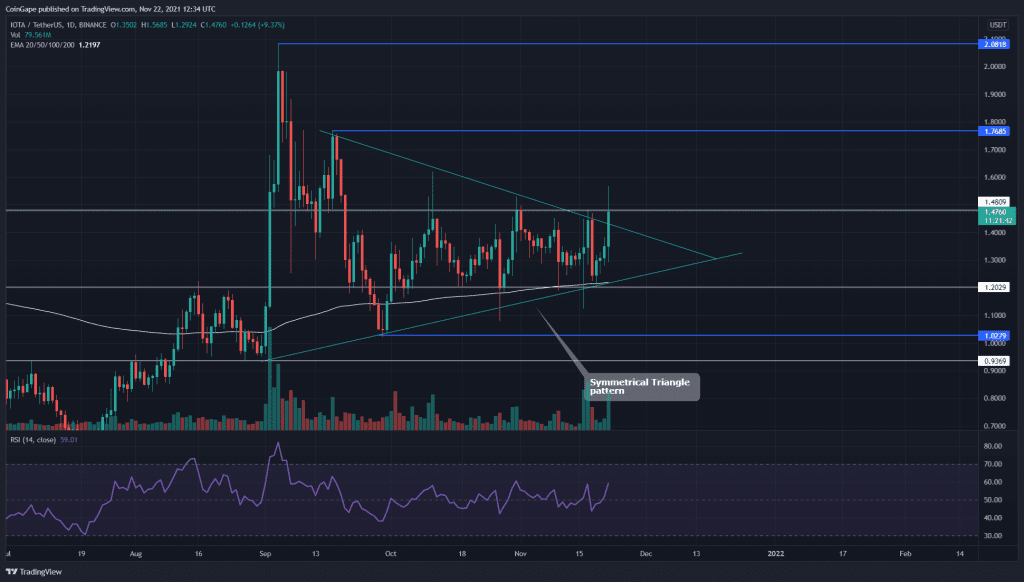
The MIOTA coin has been traveling in a sideways trend for two months now. In this consolidation, the price formed a symmetrical triangle pattern in the daily time frame chart. A recent news that added more popularity for IOTA was announcing the launch of a new incentivized staging network, ‘Shimmer.’
Key technical points:
- The MIOTA price gave a breakout from a symmetrical triangle pattern in the daily time frame chart
- The intraday trading volume in the MIOTA coin is $399 Million, indicating a 555.6% gain
Source- MIOTA/USD chart by Tradingview
After rejecting the $2 mark on September 5th, the MIOTA coin entered into a deep correction phase that plunged the price to the $1 mark. Since then, the coin has been consolidating within this range, which eventually revealed a symmetrical triangle pattern.
The coin price resonated in this pattern for more than two months, when today it finally attempts a strong breakout from the overhead resistance trendline. As per the crucial EMAs, the MIOTA maintains its bullish trend by trading above the 200 EMA.
moreover, The Relative Strength Index value at 58 indicates a bullish sentiment in the coin.
MIOTA/USD Chart In The 4-hour Time Frame

Source- MIOTA/USD chart by Tradingview
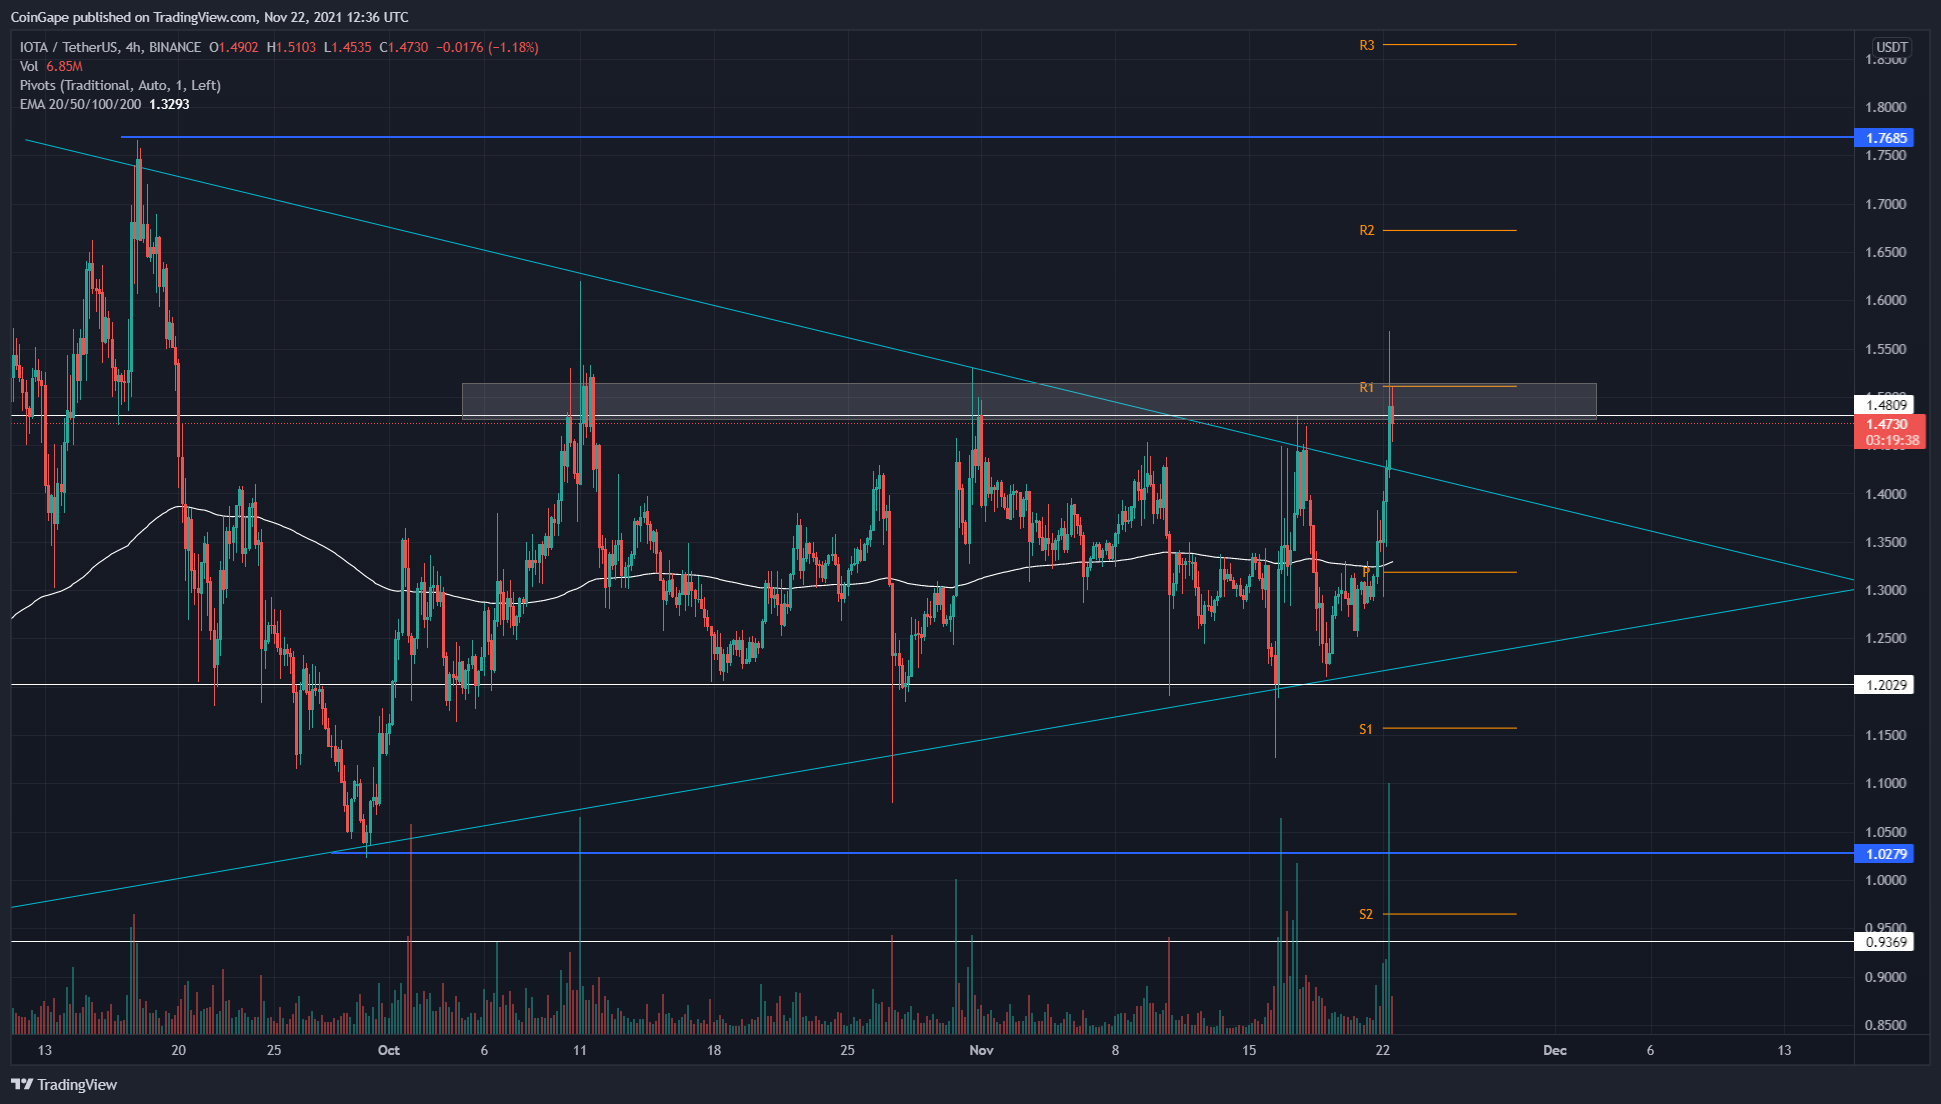
The MIOTA coin gave a 4-hour candle closing above the resistance trendline, supported by a massive surge in the volume activity. However, the higher price rejecting in this candle adds some concern about this breakout, and therefore, the crypto trader should ensure the coin price obtains sufficient support in its retest phase before taking a long entry.
As per the traditional pivot levels, the crypto trader can expect the nearest resistance level for this coin at $1.5, then at $1.67. And on the flip side, the support level is $1.13.


